Original document
GPT Image 2 · en
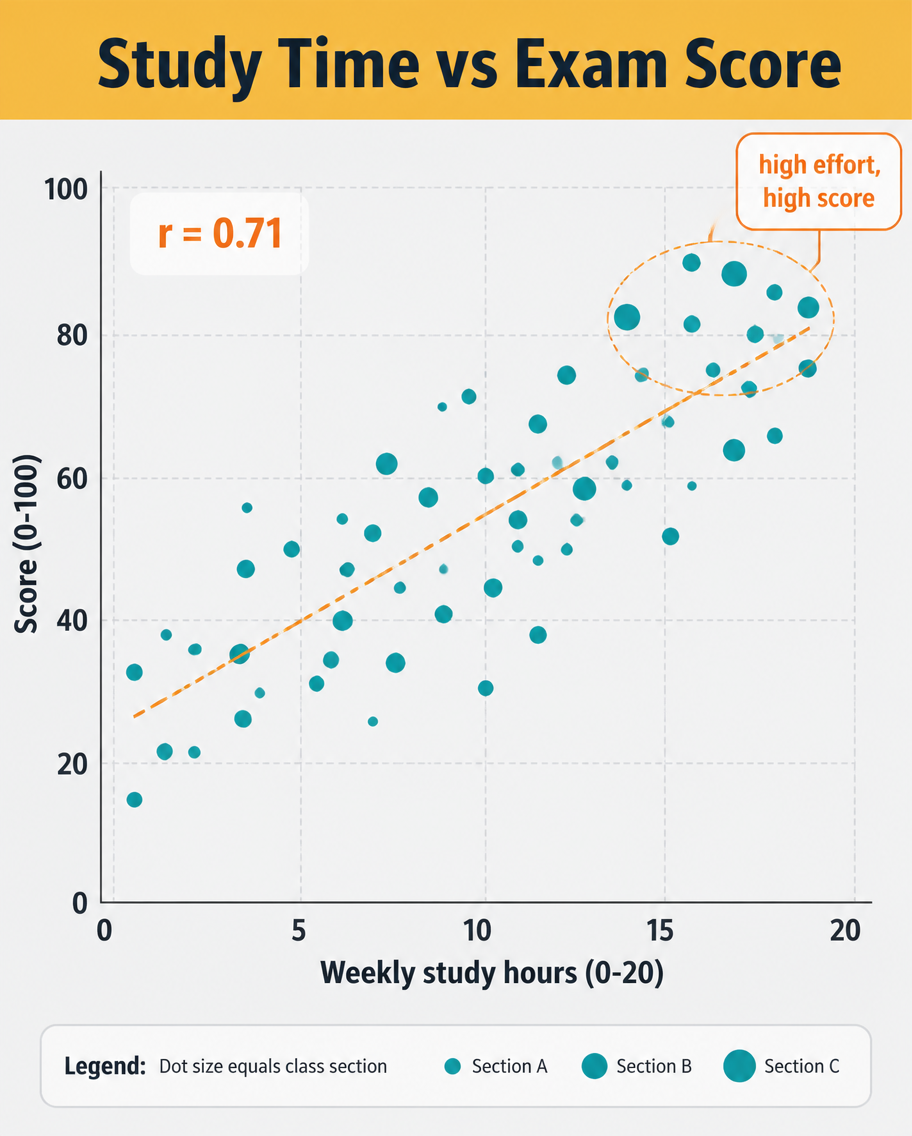
A data infographic, 4:5, titled 'Study Time vs Exam Score'. A scatter plot dominates: roughly 40 dots scattered upward-right, each a small teal circle, with a dashed orange trend line rising through them and a label 'r = 0.71'. X-axis 'Weekly study hours (0-20)', Y-axis 'Score (0-100)', light grid. A highlighted cluster near the top-right is circled with a callout 'high effort, high score'. Header on a mustard band, pale grey plot background, clean sans-serif, small legend explaining dot size equals class section.How to use
- Copy the complete original prompt, including any parameters.
- Replace the subject, text and composition with your own requirements.
- Use a compatible external tool; check its current access conditions and review the result.
Before you start
- Check whether a reference image is required. A compatible model label does not mean this example was generated with that model.
- Keep names, figures and visible text accurate; results can vary between model versions.