Originaldokument
GPT Image 2 · en
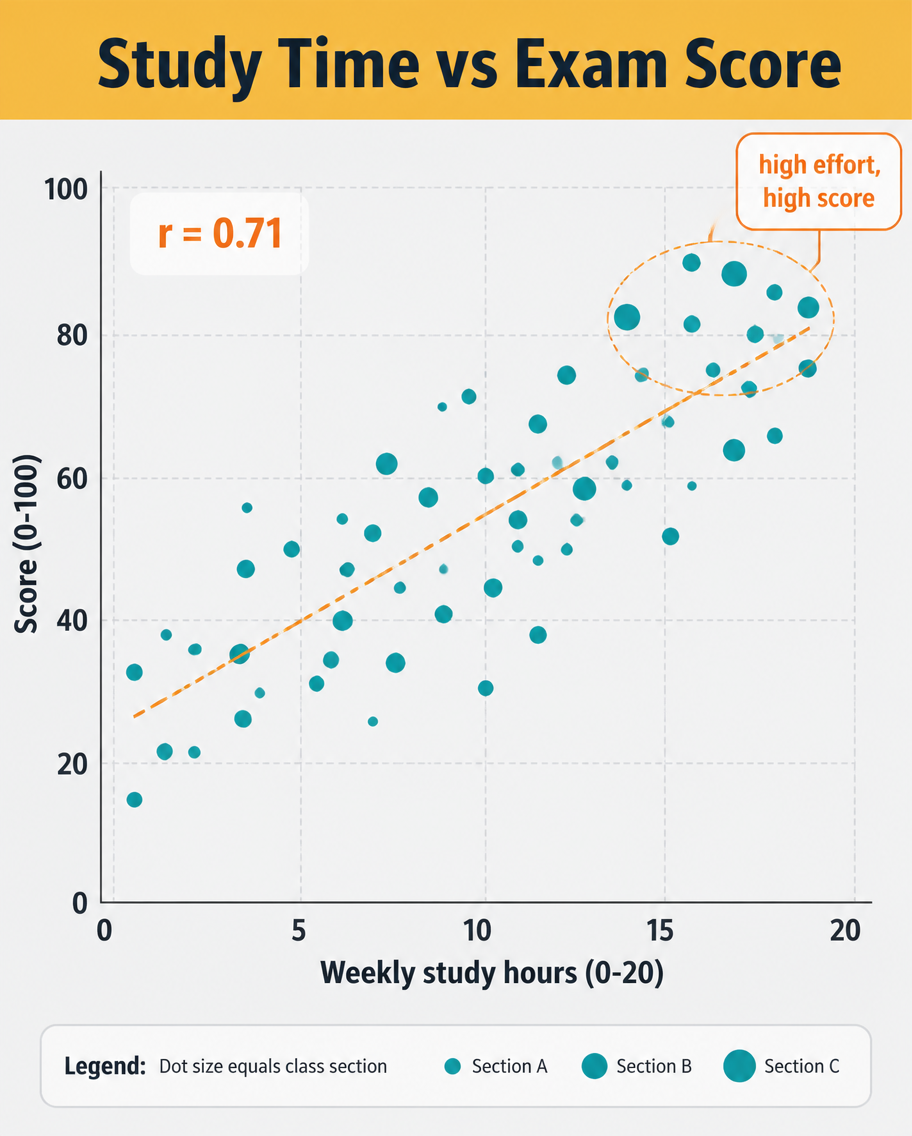
A data infographic, 4:5, titled 'Study Time vs Exam Score'. A scatter plot dominates: roughly 40 dots scattered upward-right, each a small teal circle, with a dashed orange trend line rising through them and a label 'r = 0.71'. X-axis 'Weekly study hours (0-20)', Y-axis 'Score (0-100)', light grid. A highlighted cluster near the top-right is circled with a callout 'high effort, high score'. Header on a mustard band, pale grey plot background, clean sans-serif, small legend explaining dot size equals class section.Verwendung
- Den vollständigen Original-Prompt einschließlich Parametern kopieren.
- Motiv, Text und Komposition an die eigenen Anforderungen anpassen.
- Ein kompatibles externes Werkzeug nutzen; Zugangsbedingungen und Ergebnis prüfen.
Vor dem Start
- Prüfen, ob ein Referenzbild nötig ist. Kompatibilität belegt nicht das tatsächlich verwendete Modell.
- Namen, Zahlen und Bildtexte prüfen; Modellversionen können andere Ergebnisse liefern.