Oryginalny dokument
GPT Image 2 · en
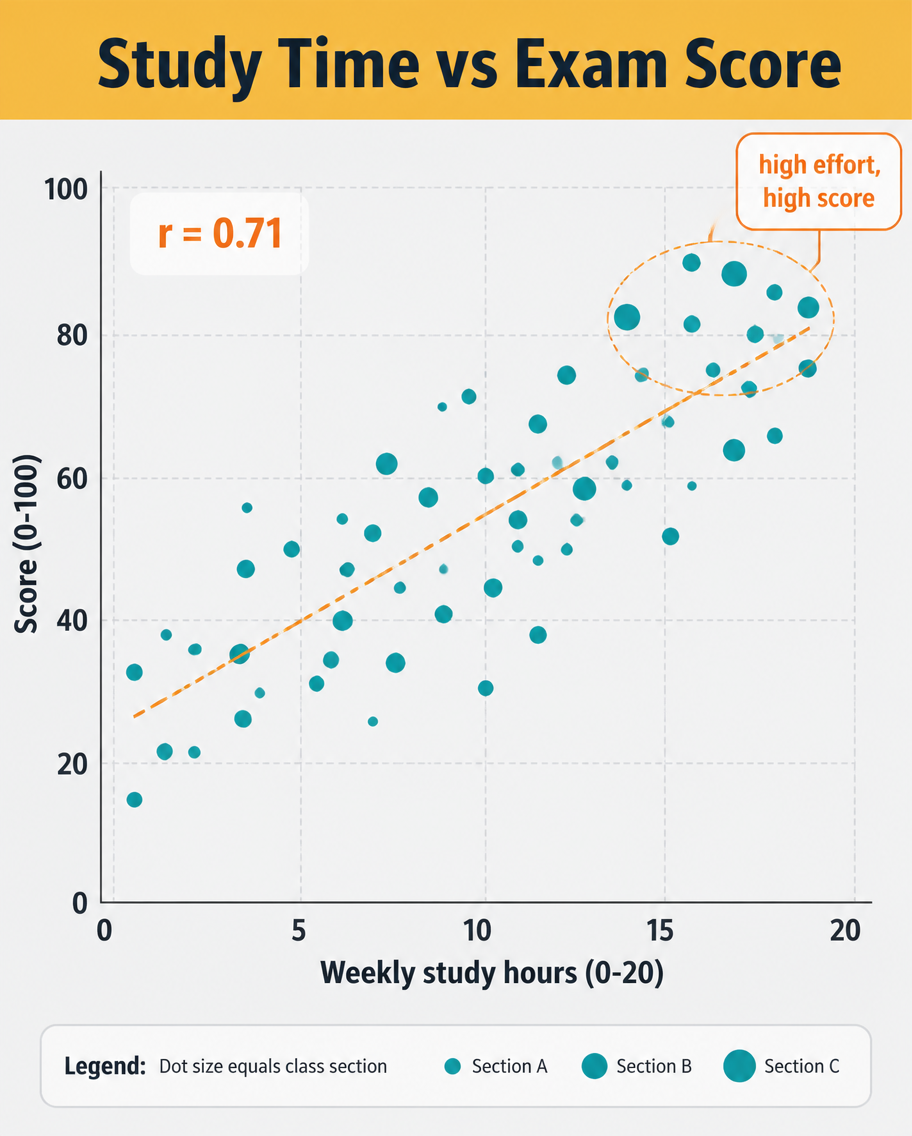
A data infographic, 4:5, titled 'Study Time vs Exam Score'. A scatter plot dominates: roughly 40 dots scattered upward-right, each a small teal circle, with a dashed orange trend line rising through them and a label 'r = 0.71'. X-axis 'Weekly study hours (0-20)', Y-axis 'Score (0-100)', light grid. A highlighted cluster near the top-right is circled with a callout 'high effort, high score'. Header on a mustard band, pale grey plot background, clean sans-serif, small legend explaining dot size equals class section.Jak używać
- Skopiuj cały oryginalny prompt wraz z parametrami.
- Dostosuj temat, tekst i kompozycję do swoich potrzeb.
- Użyj zgodnego narzędzia zewnętrznego; sprawdź warunki dostępu i wynik.
Przed rozpoczęciem
- Sprawdź, czy potrzebny jest obraz referencyjny. Zgodność nie potwierdza modelu użytego do przykładu.
- Sprawdź nazwy, liczby i napisy; wyniki zależą od wersji modelu.