Design illustration · Study Hours Vs Scores Scatter — API Models · CC BY 4.0

Design illustration · Study Hours Vs Scores Scatter — API Models · CC BY 4.0

Documento original

GPT Image 2 · en

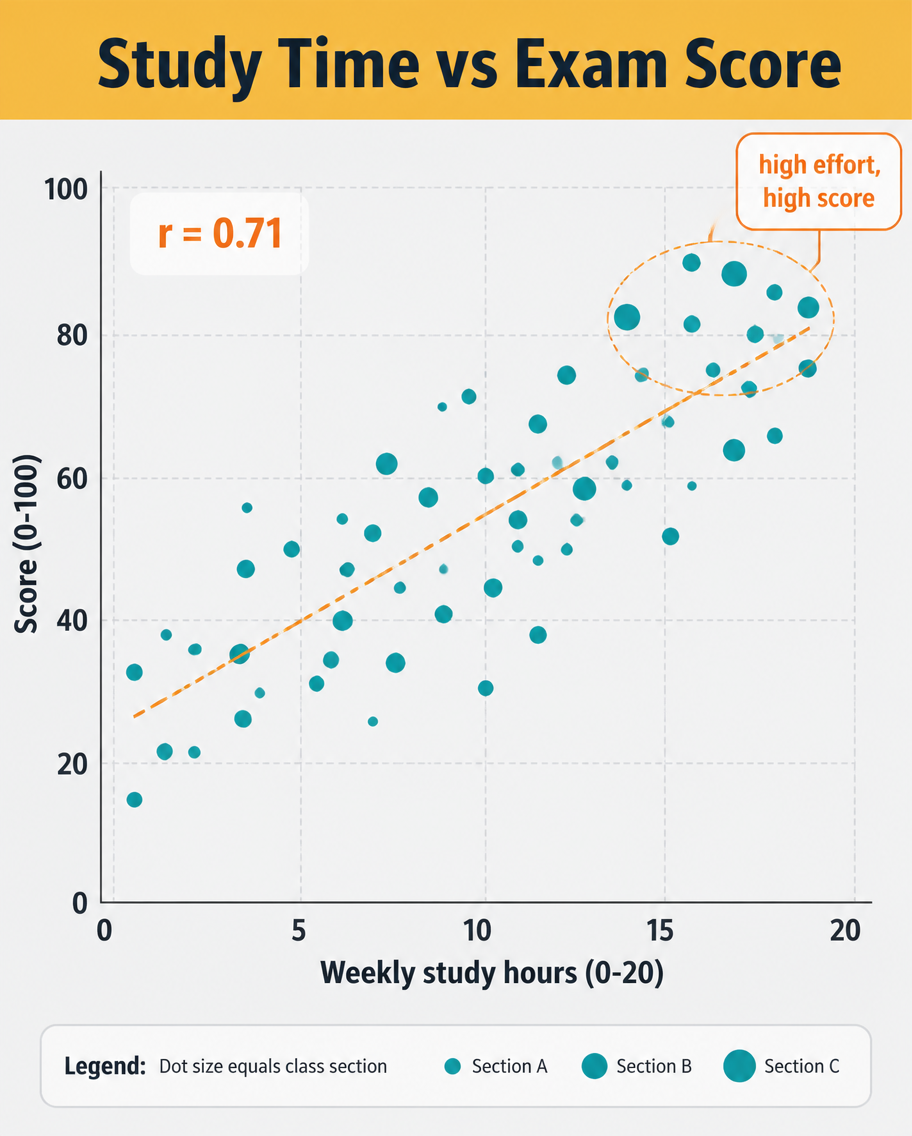
A data infographic, 4:5, titled 'Study Time vs Exam Score'. A scatter plot dominates: roughly 40 dots scattered upward-right, each a small teal circle, with a dashed orange trend line rising through them and a label 'r = 0.71'. X-axis 'Weekly study hours (0-20)', Y-axis 'Score (0-100)', light grid. A highlighted cluster near the top-right is circled with a callout 'high effort, high score'. Header on a mustard band, pale grey plot background, clean sans-serif, small legend explaining dot size equals class section.

Como usar

  1. Copie o prompt original completo, incluindo os parâmetros.
  2. Adapte o tema, o texto e a composição aos seus requisitos.
  3. Use uma ferramenta externa compatível; confira o acesso e o resultado.

Antes de começar

  • Verifique se é necessária uma imagem de referência. Compatibilidade não comprova qual modelo gerou o exemplo.
  • Confira nomes, números e textos; os resultados variam entre versões do modelo.
Exemplos semelhantes

Handwritten Japanese Study Notes with Photograph
GPT Image 2en

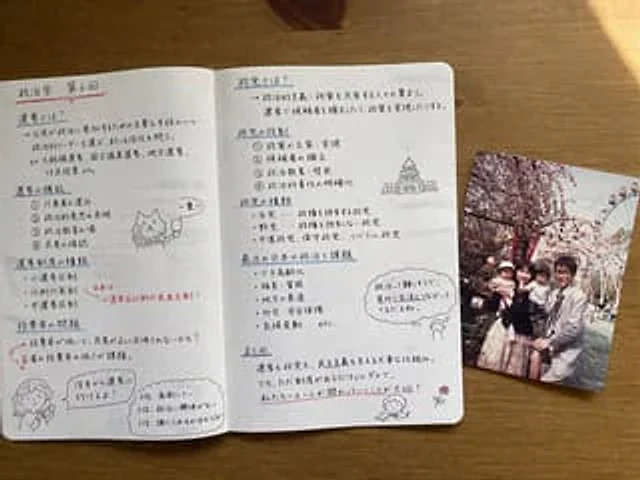
{ "type": "Photorealistic still life top view", "setting": "{argument name=\"desk surface\" default=\"wooden tabletop\"}", "objects": [ { "item": "Open notebook", "style": "{argument name=\"notebook style\" default=\"The paper has neatly handwritten Japanese

Handwritten Japanese Study Notes
GPT Image 2en

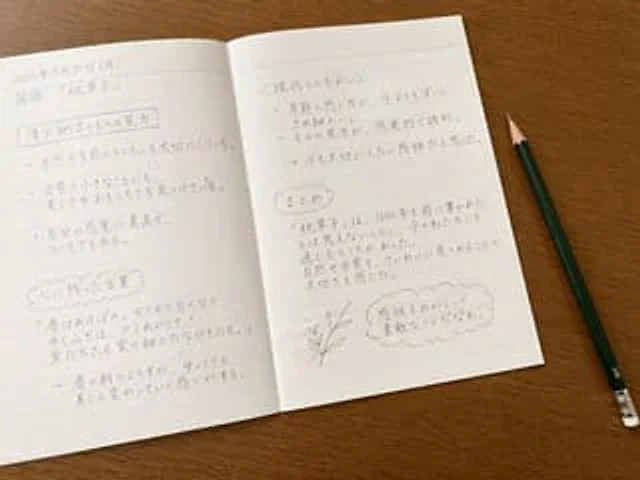
{ "type": "The handwritten notebook open on the desk", "setting": "From a top-down view, an open, lined notebook sits on a wooden desk.", "props": [ "Open the notebook with horizontal lines", "A dark green pencil with a silver metal band and a white eraser sits on t

Photographed MIDI Piano Score Sheet
GPT Image 2en

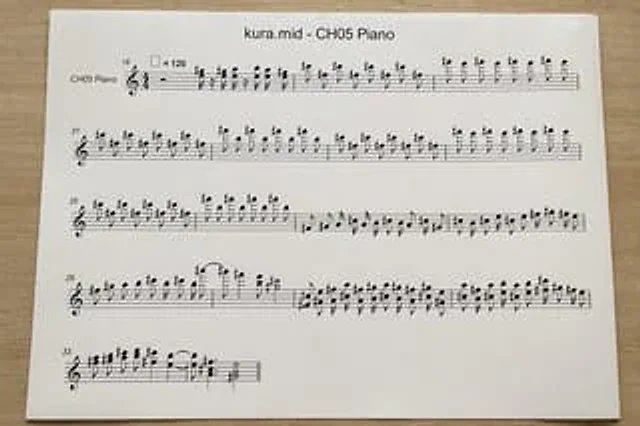
A top-down, realistic photograph of a white printed sheet of paper placed on a light-colored wooden desk showcases a computer-generated musical score. The page is horizontally centered with a slight sense of perspective, illuminated by soft natural indoor light with minimal shado

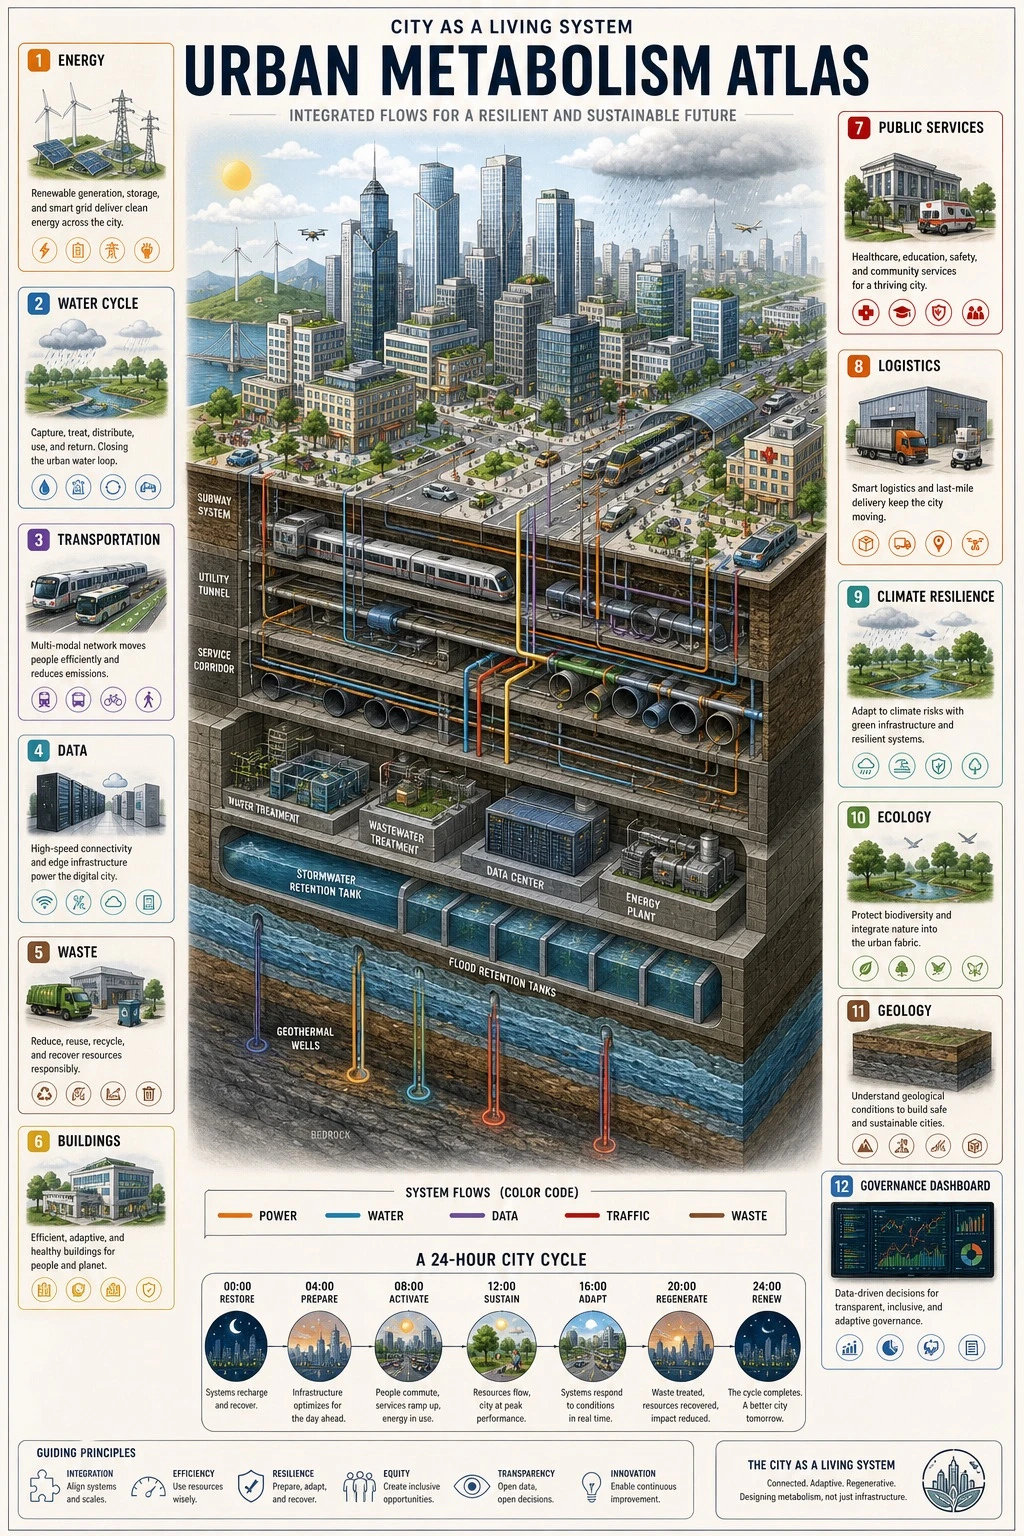
Urban Systems Infographic Layout Study — ClawLabs AI · MIT
GPT Image 2en

Vertical 9:16 isometric cutaway infographic titled '[DIAGRAM_TITLE]'. Depict a smart city from sky to bedrock, showing skyscrapers, streets, subway lines, utility tunnels, water/sewage/gas/heating pipes, fiber optic cables, a data center, flood retention tanks, aquifers, geotherm