Documento originale
GPT Image 2 · en
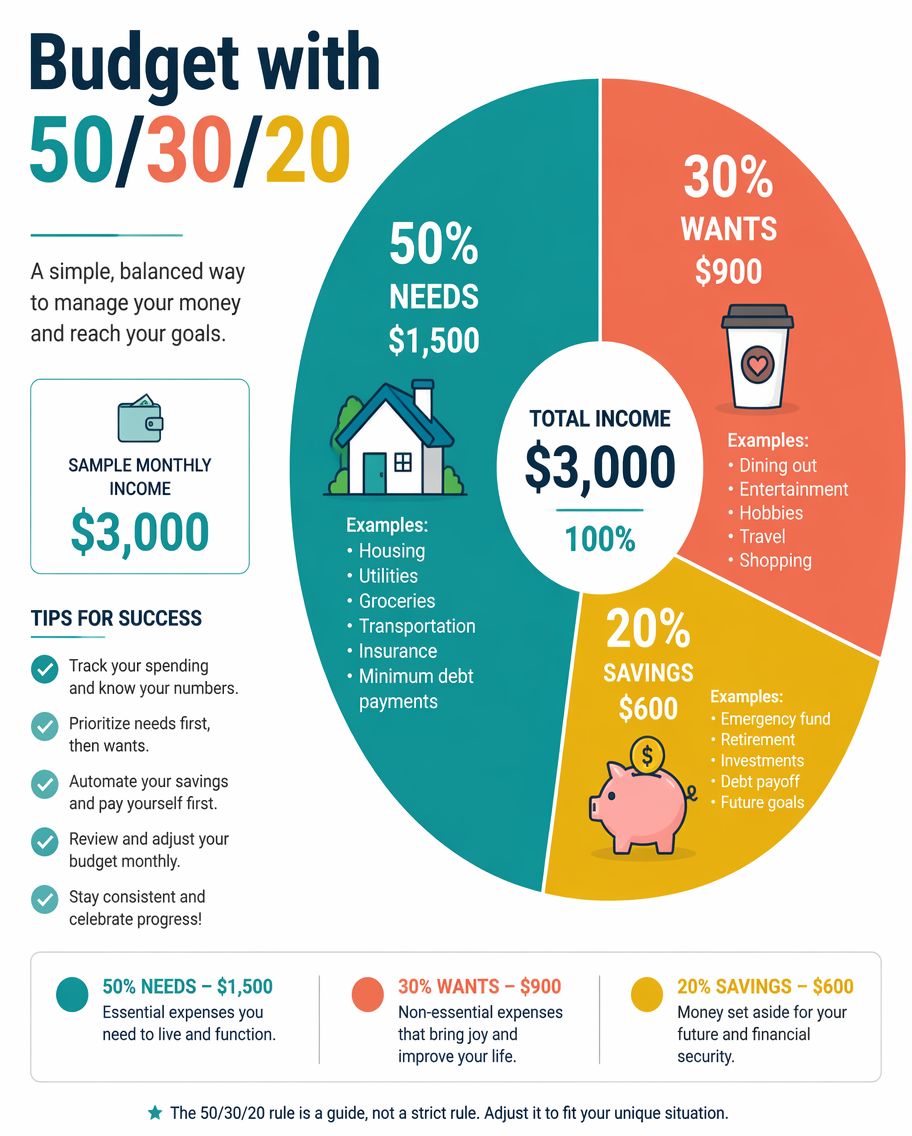
A personal-finance infographic explaining the 50/30/20 budgeting rule as a large donut chart split into three wedges - 50% needs, 30% wants, 20% savings - each labeled with example categories and icons (a house, a coffee cup, a piggy bank). A sample monthly income of $3,000 shows the dollar split beside each slice. Clean modern flat style, a teal, coral and gold palette on white. Bold title 'Budget with 50/30/20' upper-left, a small checklist of tips and a legend along the base.Come usare
- Copia tutto il prompt originale, inclusi i parametri.
- Adatta soggetto, testo e composizione alle tue esigenze.
- Usa uno strumento esterno compatibile; verifica accesso e risultato.
Prima di iniziare
- Controlla se serve un’immagine di riferimento. La compatibilità non prova il modello usato per l’esempio.
- Verifica nomi, numeri e testi; i risultati cambiano con le versioni del modello.