原文
GPT Image 2 · en
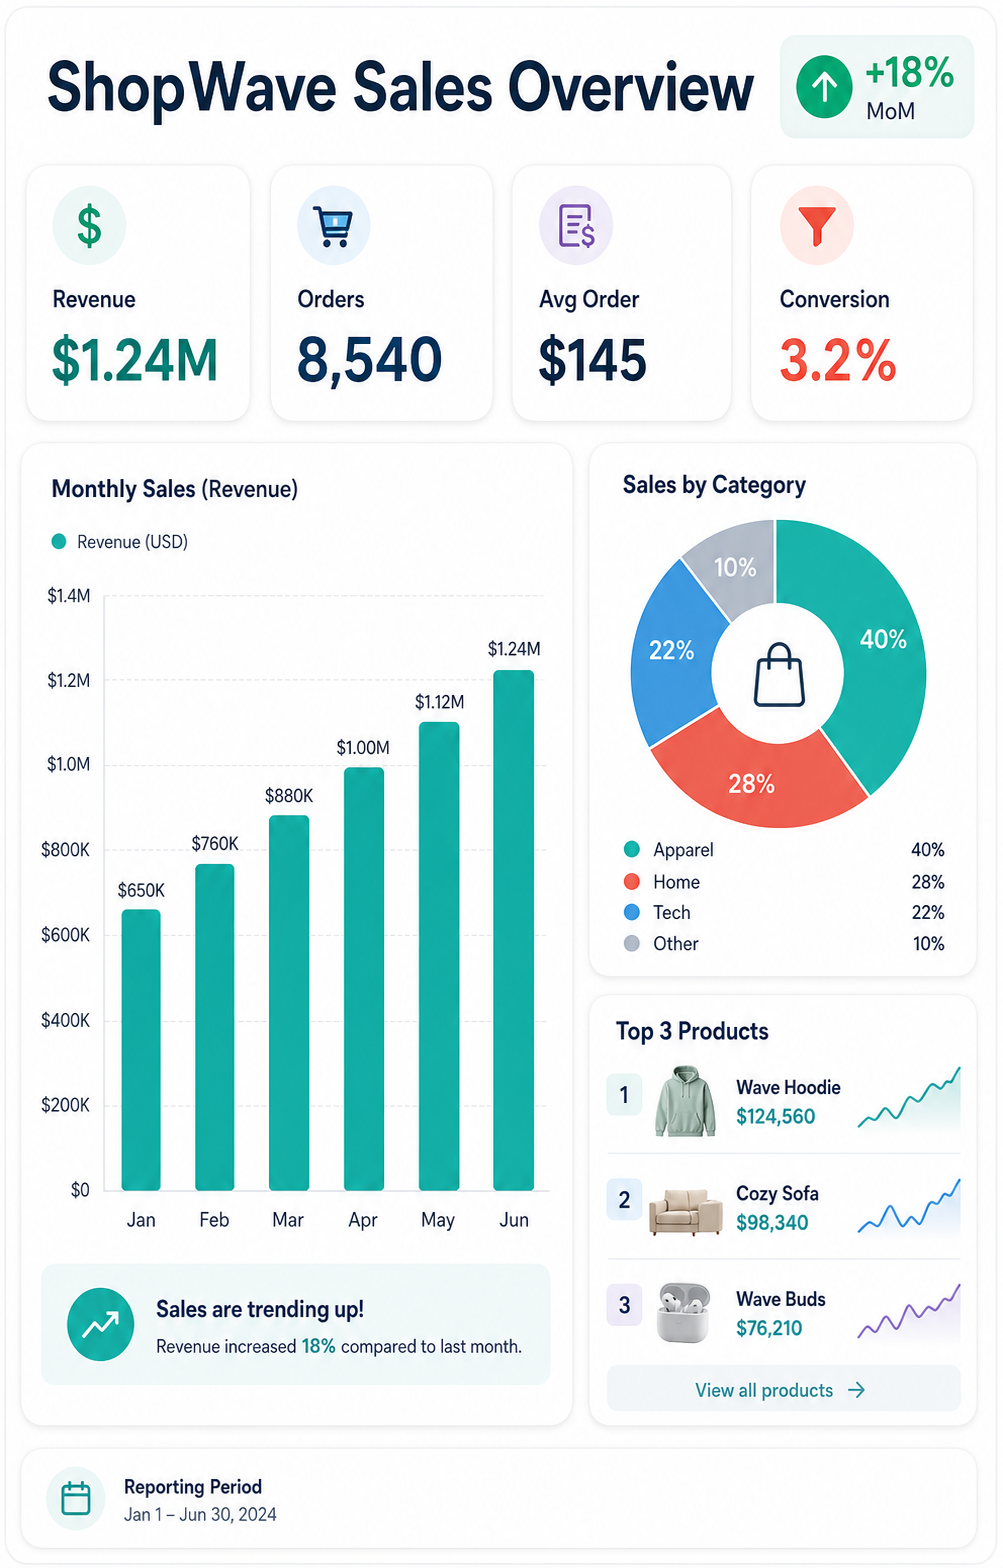
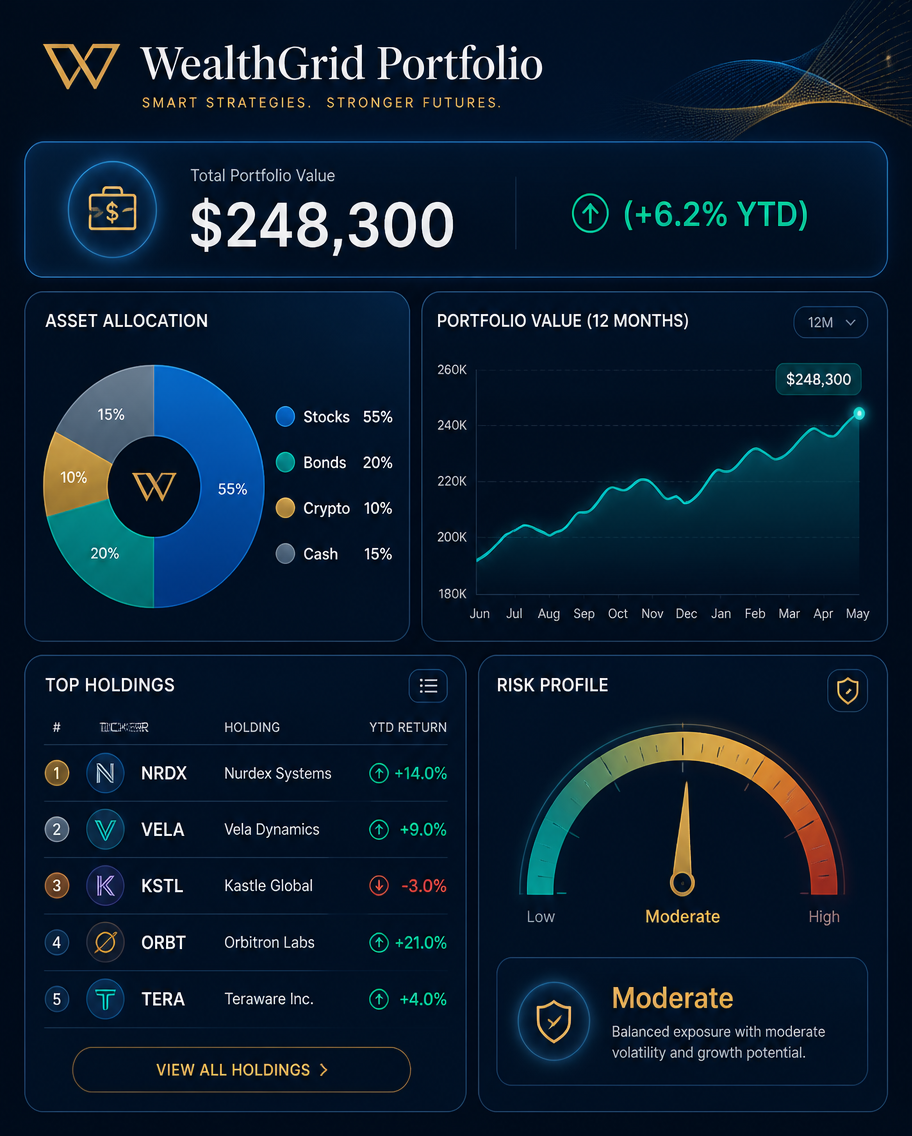
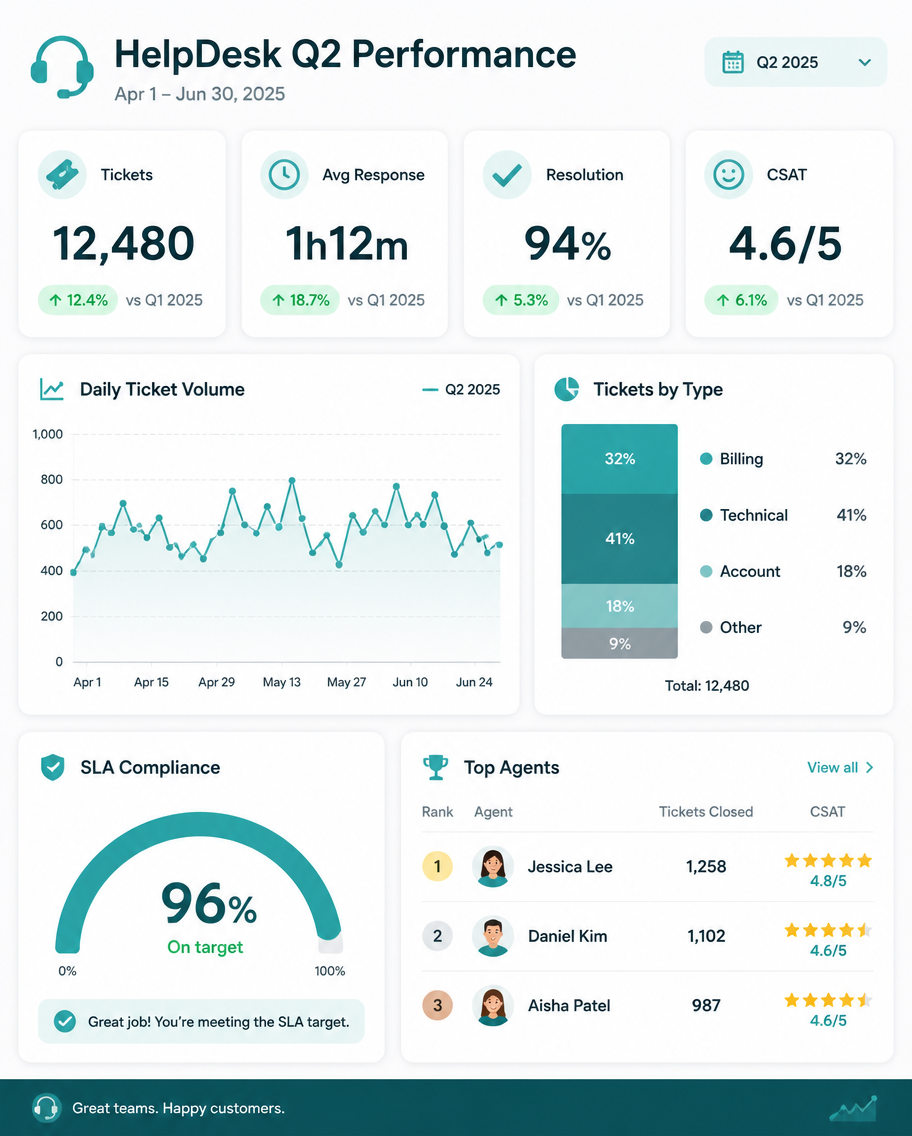
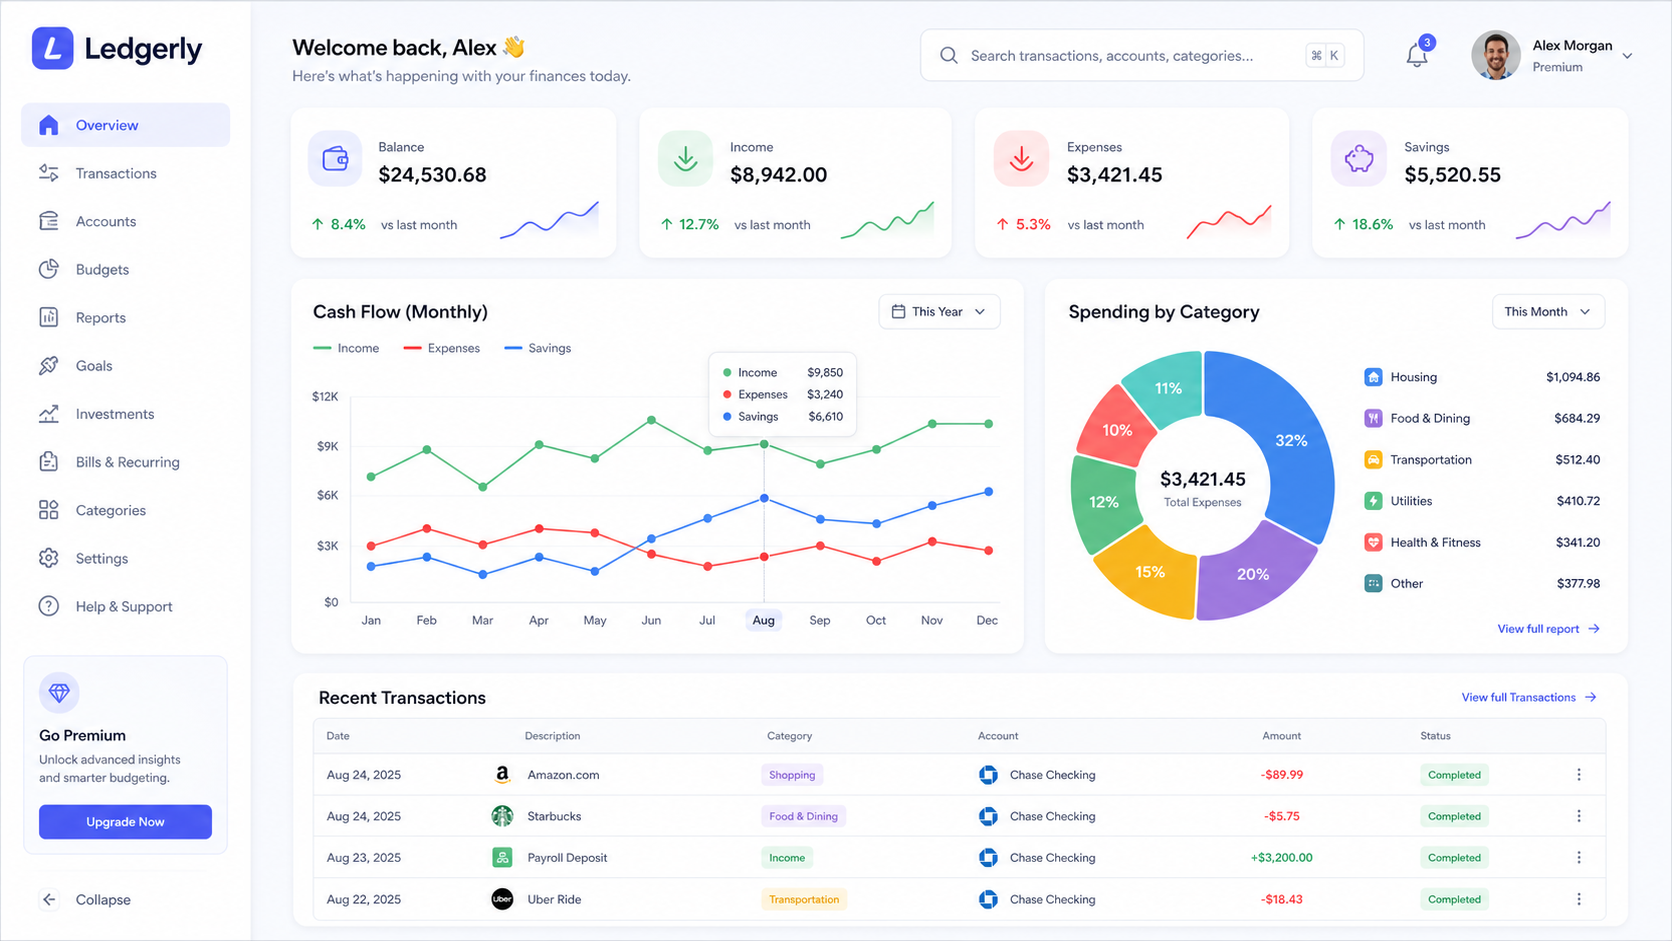
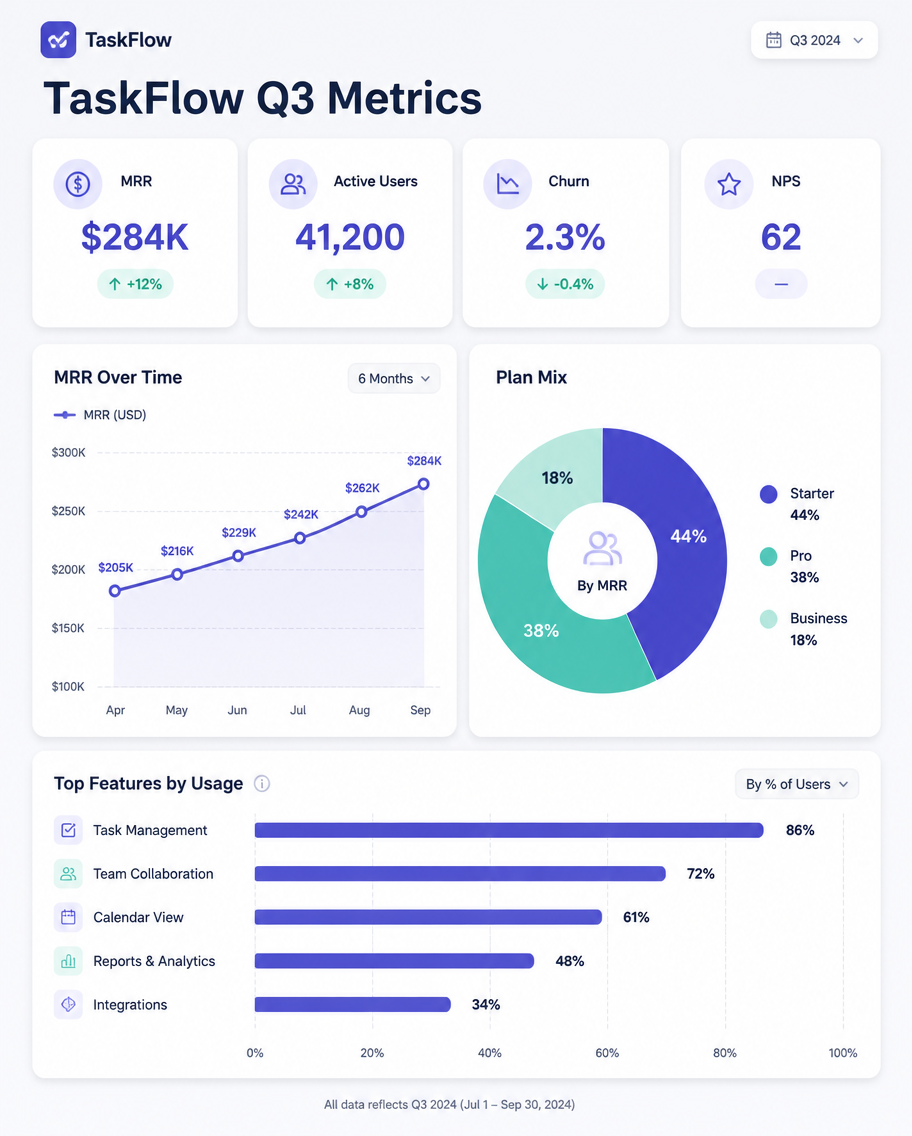
A dashboard-style infographic, 4:5, titled 'TaskFlow Q3 Metrics'. A clean report slide with a top KPI row of four cards: MRR $284K (+12%), Active Users 41,200 (+8%), Churn 2.3% (-0.4%), NPS 62. Below, a two-column layout: left a line chart of revenue climbing over 6 months, right a donut of plan mix (Starter 44%, Pro 38%, Business 18%). A small horizontal bar of top features by usage. Light dashboard-grey background, indigo and mint accents, rounded card widgets, subtle shadows, modern analytics-UI aesthetic, tidy sans-serif.使い方
- パラメータを含む元のプロンプト全体をコピーします。
- 被写体、文字、構図を自分の要件に置き換えます。
- 対応する外部ツールで使用し、利用条件と結果を確認します。
開始前の確認
- 参考画像の要否を確認してください。互換モデルの表示は、そのモデルでの生成実績を意味しません。
- 名前、数値、画像内の文字を確認します。モデルの版で結果は変わります。