원본 문서
GPT Image 2 · en
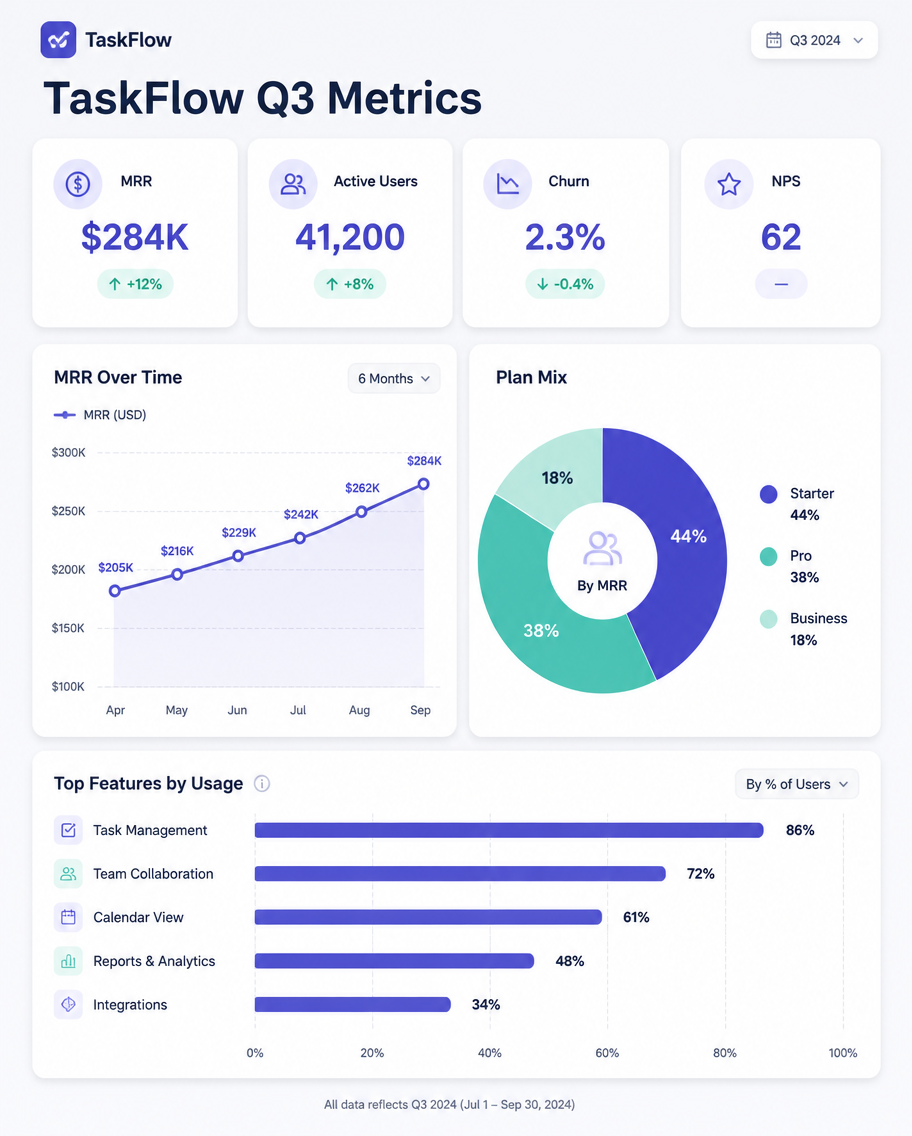
A dashboard-style infographic, 4:5, titled 'TaskFlow Q3 Metrics'. A clean report slide with a top KPI row of four cards: MRR $284K (+12%), Active Users 41,200 (+8%), Churn 2.3% (-0.4%), NPS 62. Below, a two-column layout: left a line chart of revenue climbing over 6 months, right a donut of plan mix (Starter 44%, Pro 38%, Business 18%). A small horizontal bar of top features by usage. Light dashboard-grey background, indigo and mint accents, rounded card widgets, subtle shadows, modern analytics-UI aesthetic, tidy sans-serif.사용 방법
- 매개변수를 포함한 전체 원본 프롬프트를 복사하세요.
- 주제, 문구, 구도를 자신의 요구에 맞게 바꾸세요.
- 호환되는 외부 도구에서 사용하고 이용 조건과 결과를 확인하세요.
시작 전 확인
- 참조 이미지가 필요한지 확인하세요. 호환 표시는 해당 모델로 이 예시를 생성했다는 뜻이 아닙니다.
- 이름, 수치, 이미지 속 문구를 확인하세요. 모델 버전에 따라 결과가 다를 수 있습니다.