Original document
GPT Image 2 · en
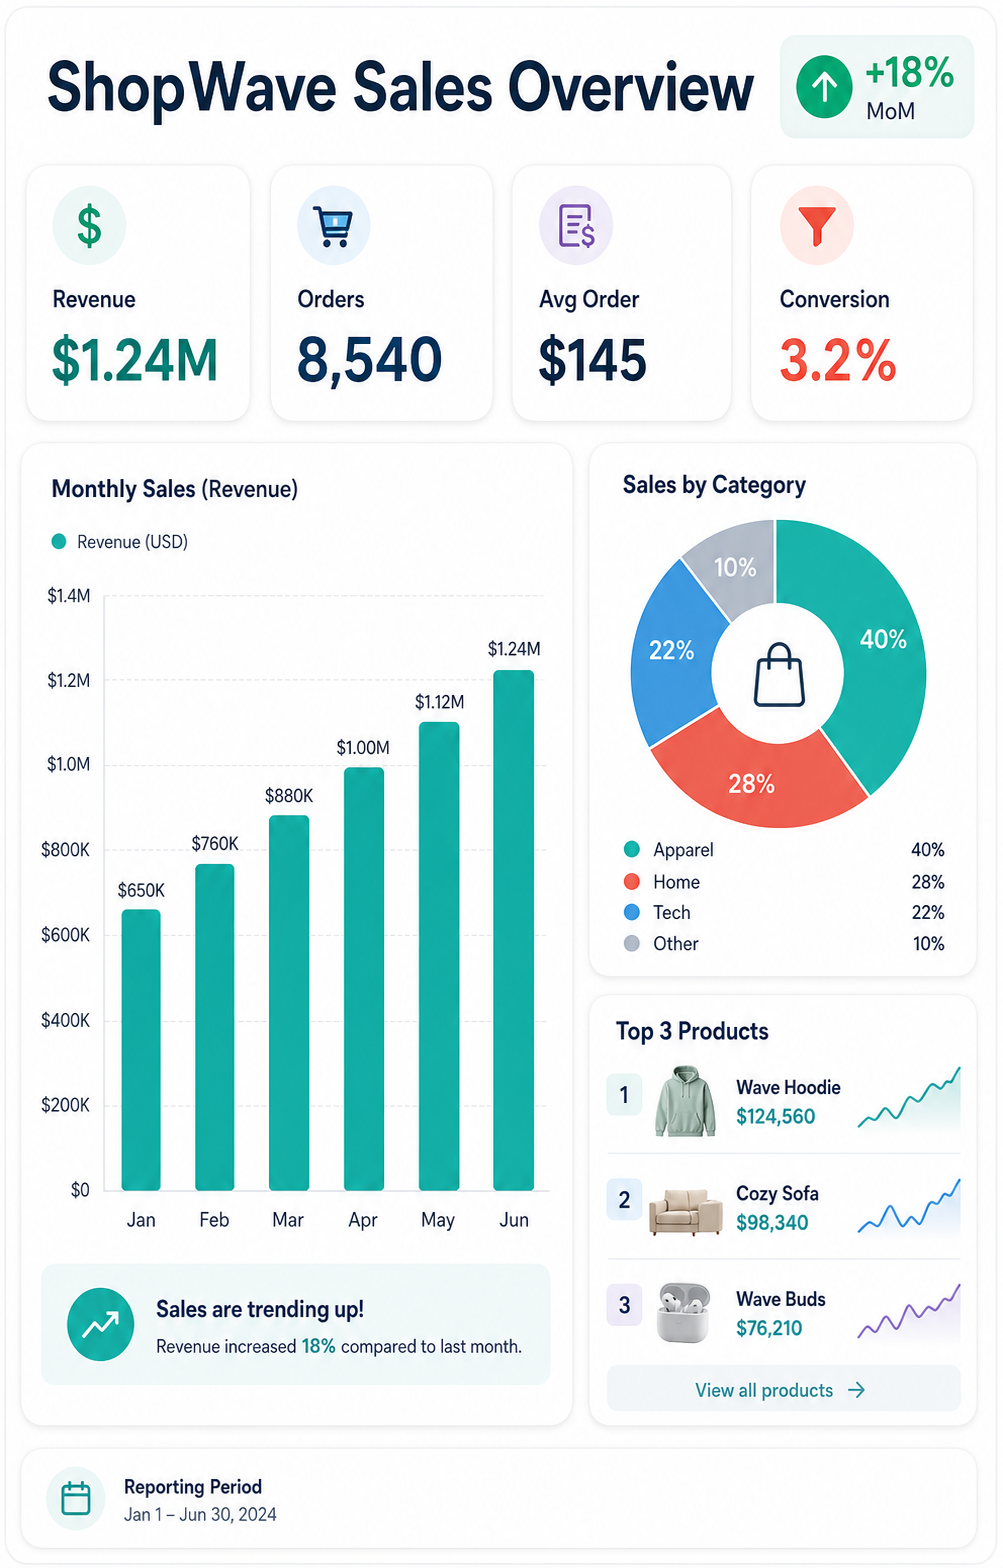
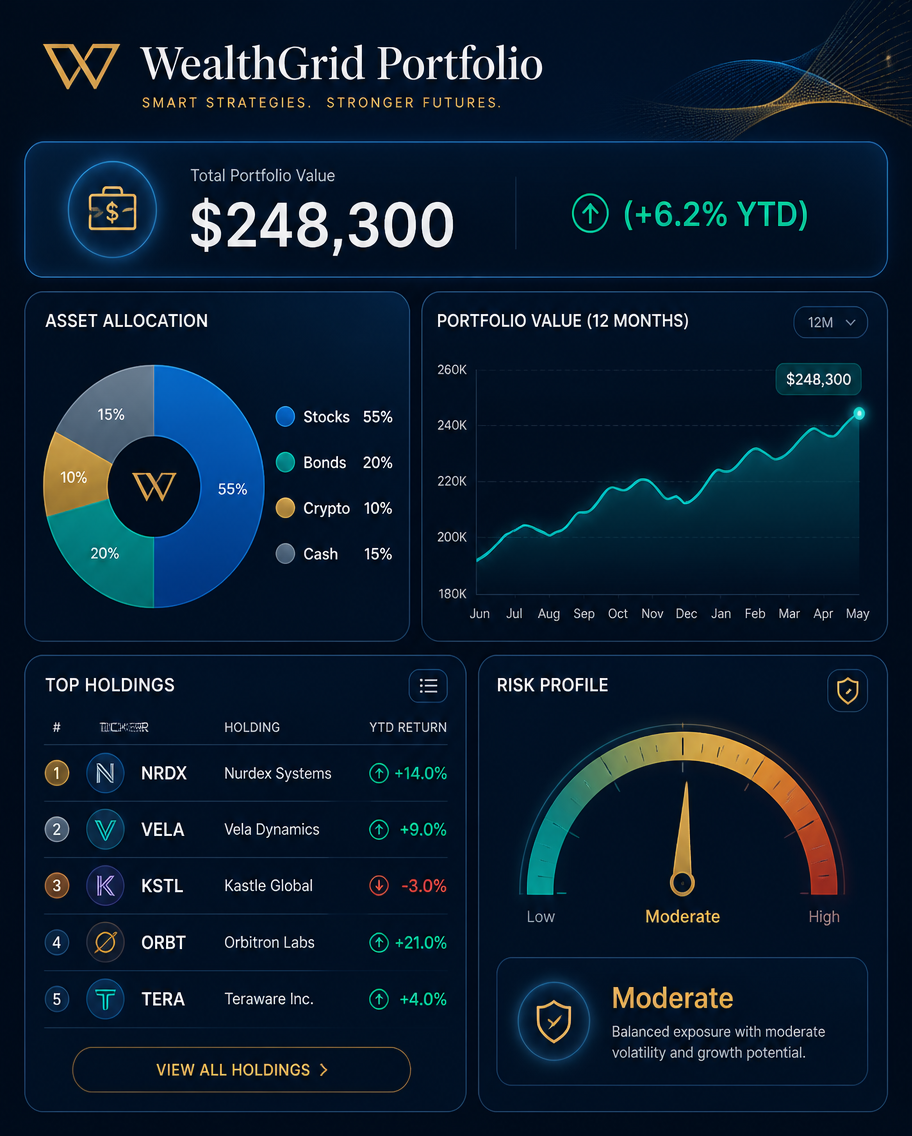
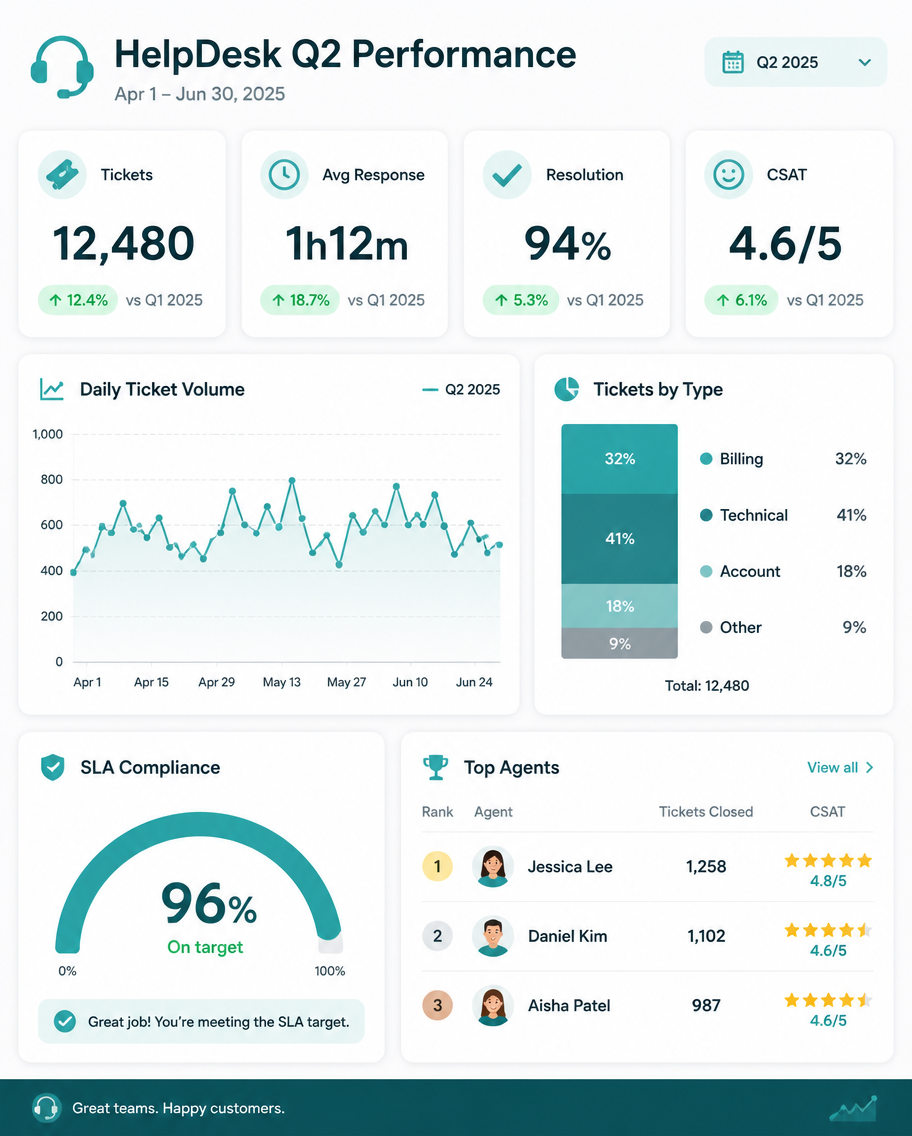
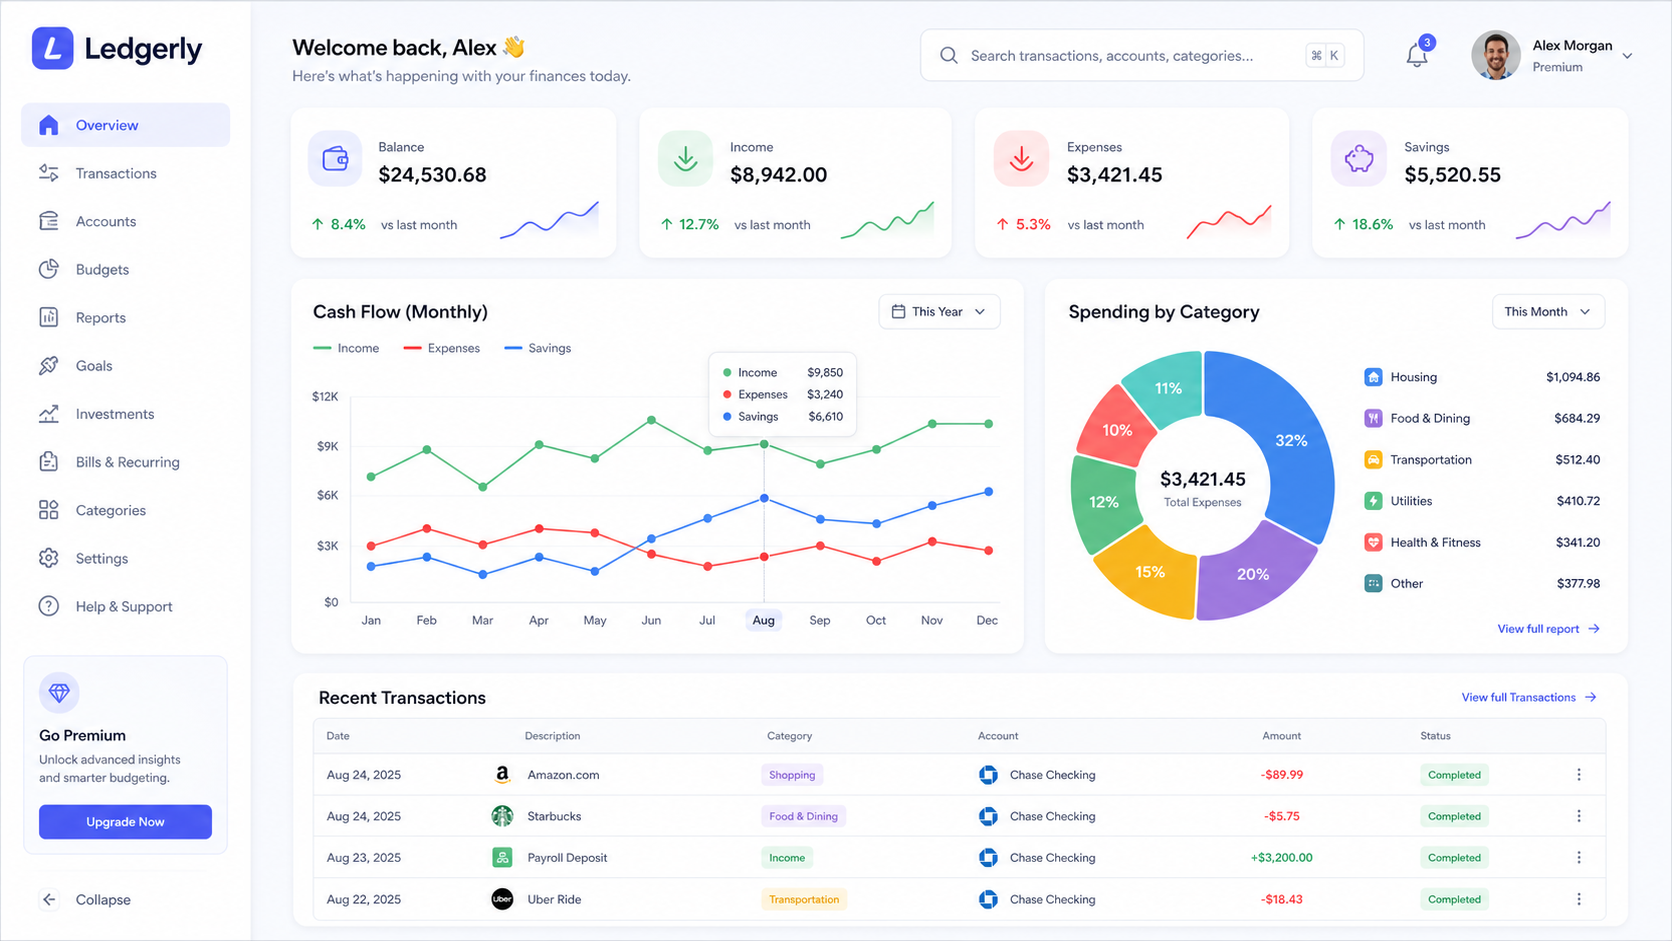
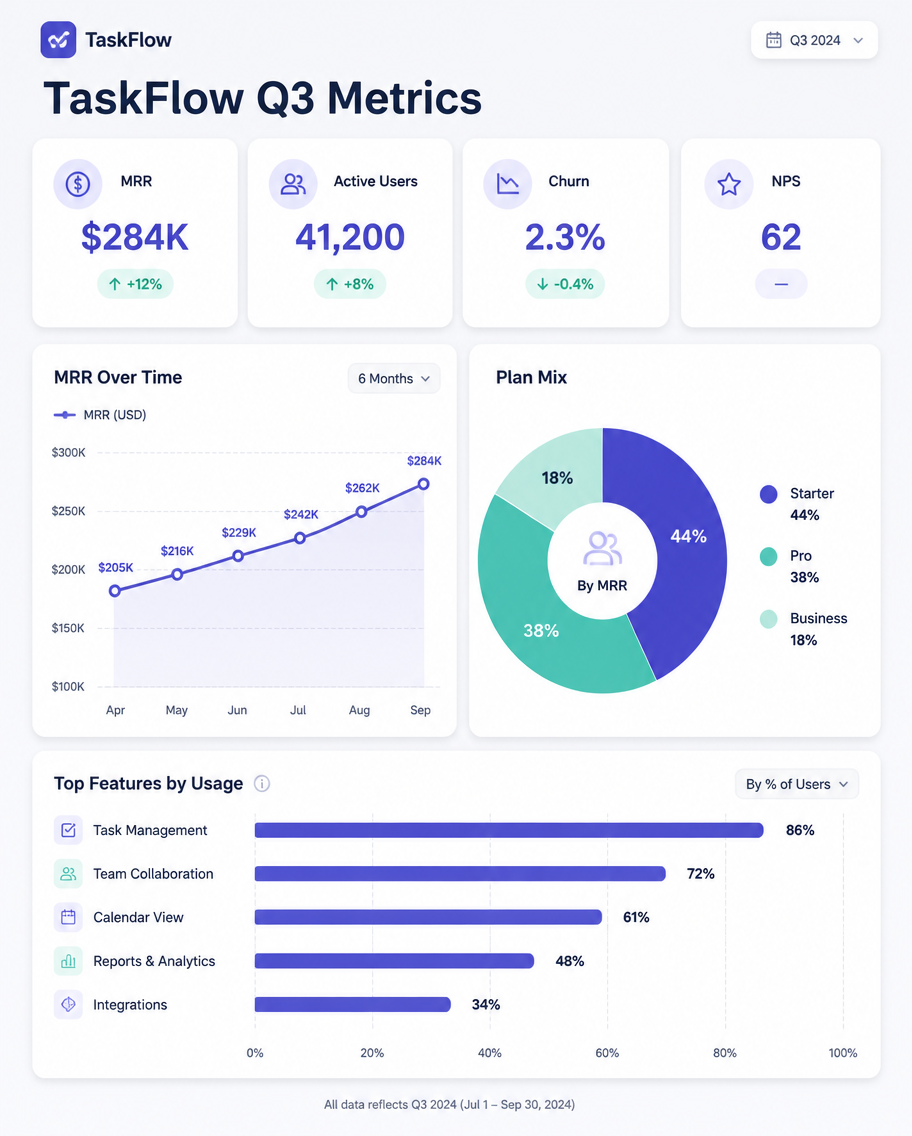
A dashboard-style infographic, 4:5, titled 'TaskFlow Q3 Metrics'. A clean report slide with a top KPI row of four cards: MRR $284K (+12%), Active Users 41,200 (+8%), Churn 2.3% (-0.4%), NPS 62. Below, a two-column layout: left a line chart of revenue climbing over 6 months, right a donut of plan mix (Starter 44%, Pro 38%, Business 18%). A small horizontal bar of top features by usage. Light dashboard-grey background, indigo and mint accents, rounded card widgets, subtle shadows, modern analytics-UI aesthetic, tidy sans-serif.How to use
- Copy the complete original prompt, including any parameters.
- Replace the subject, text and composition with your own requirements.
- Use a compatible external tool; check its current access conditions and review the result.
Before you start
- Check whether a reference image is required. A compatible model label does not mean this example was generated with that model.
- Keep names, figures and visible text accurate; results can vary between model versions.