Documento original
GPT Image 2 · en
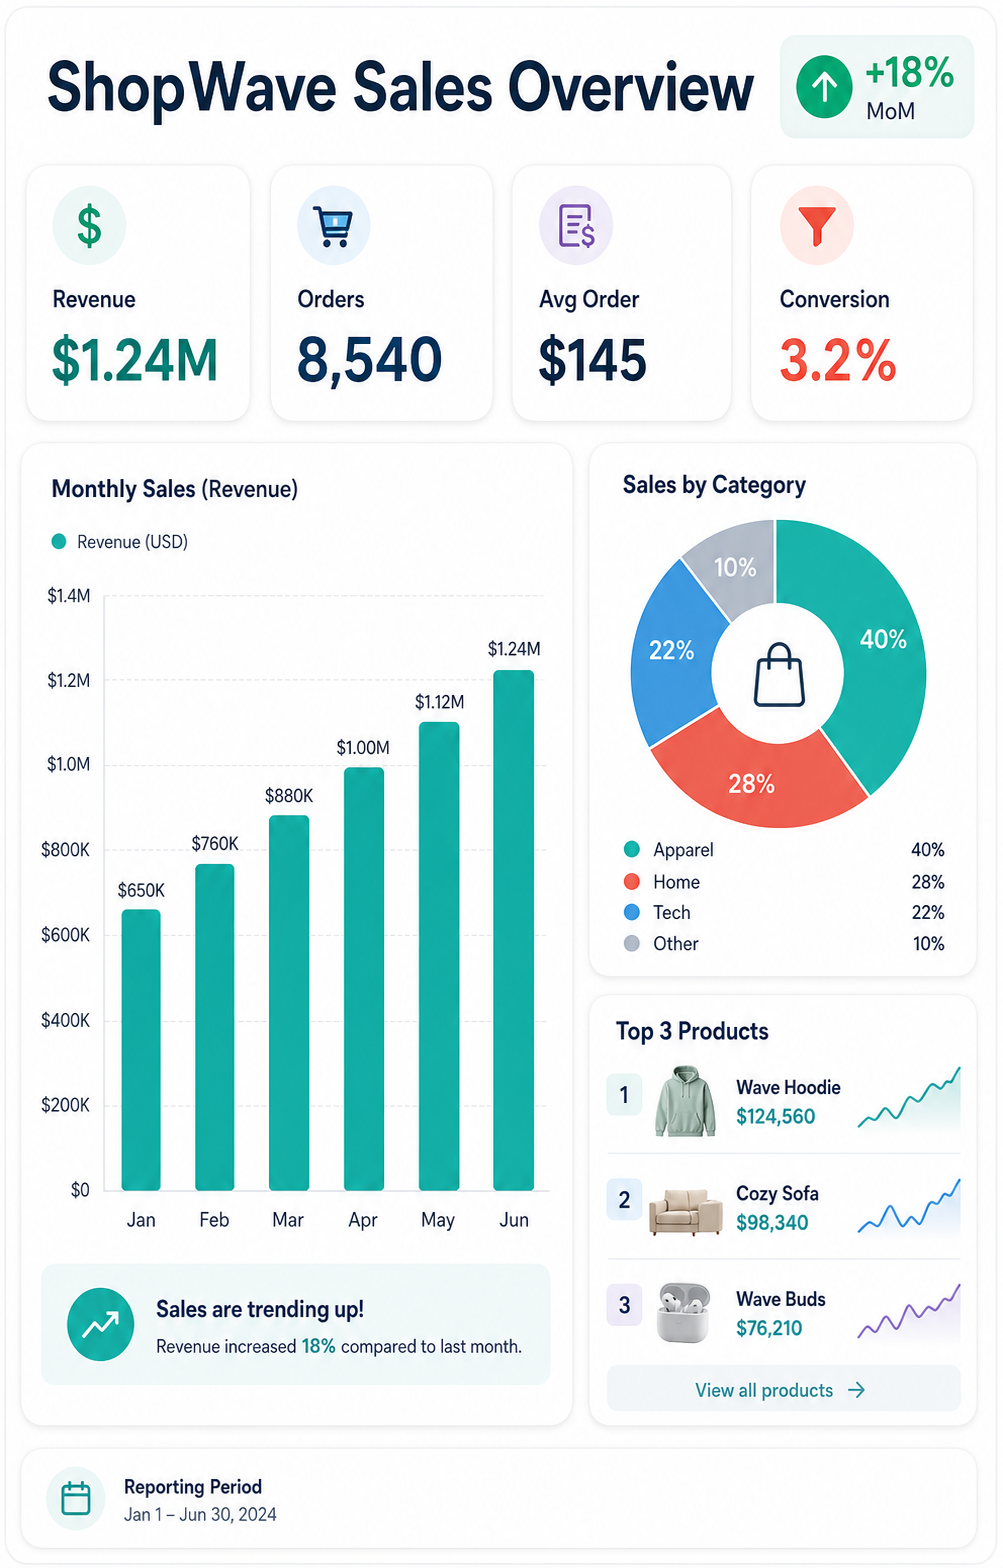
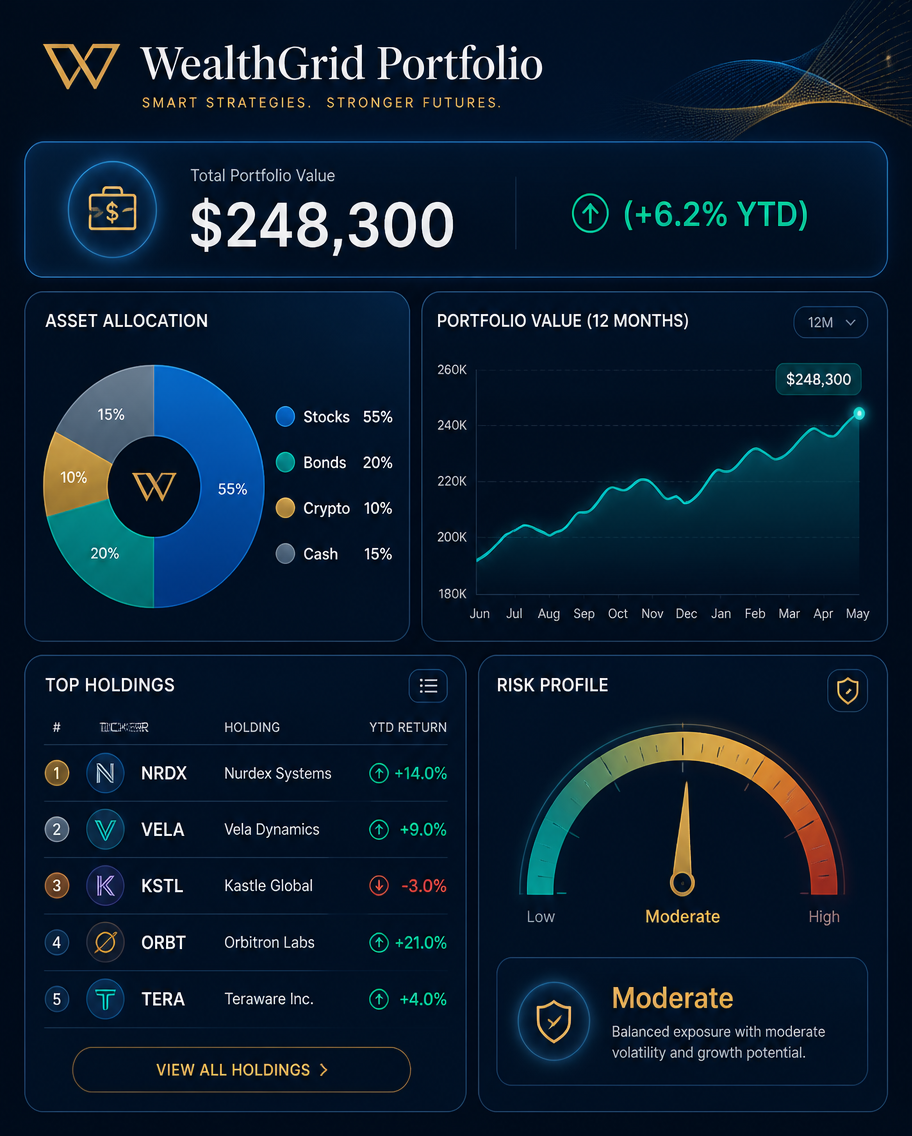
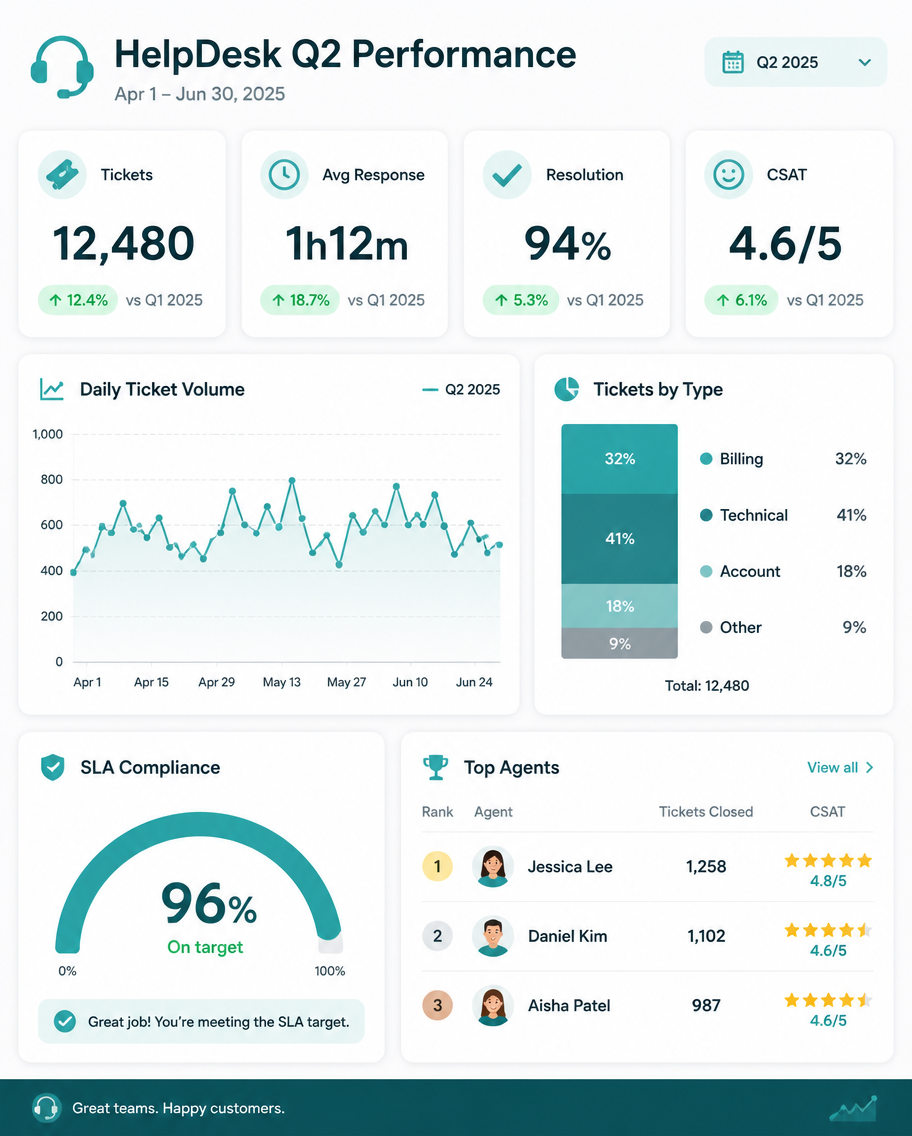
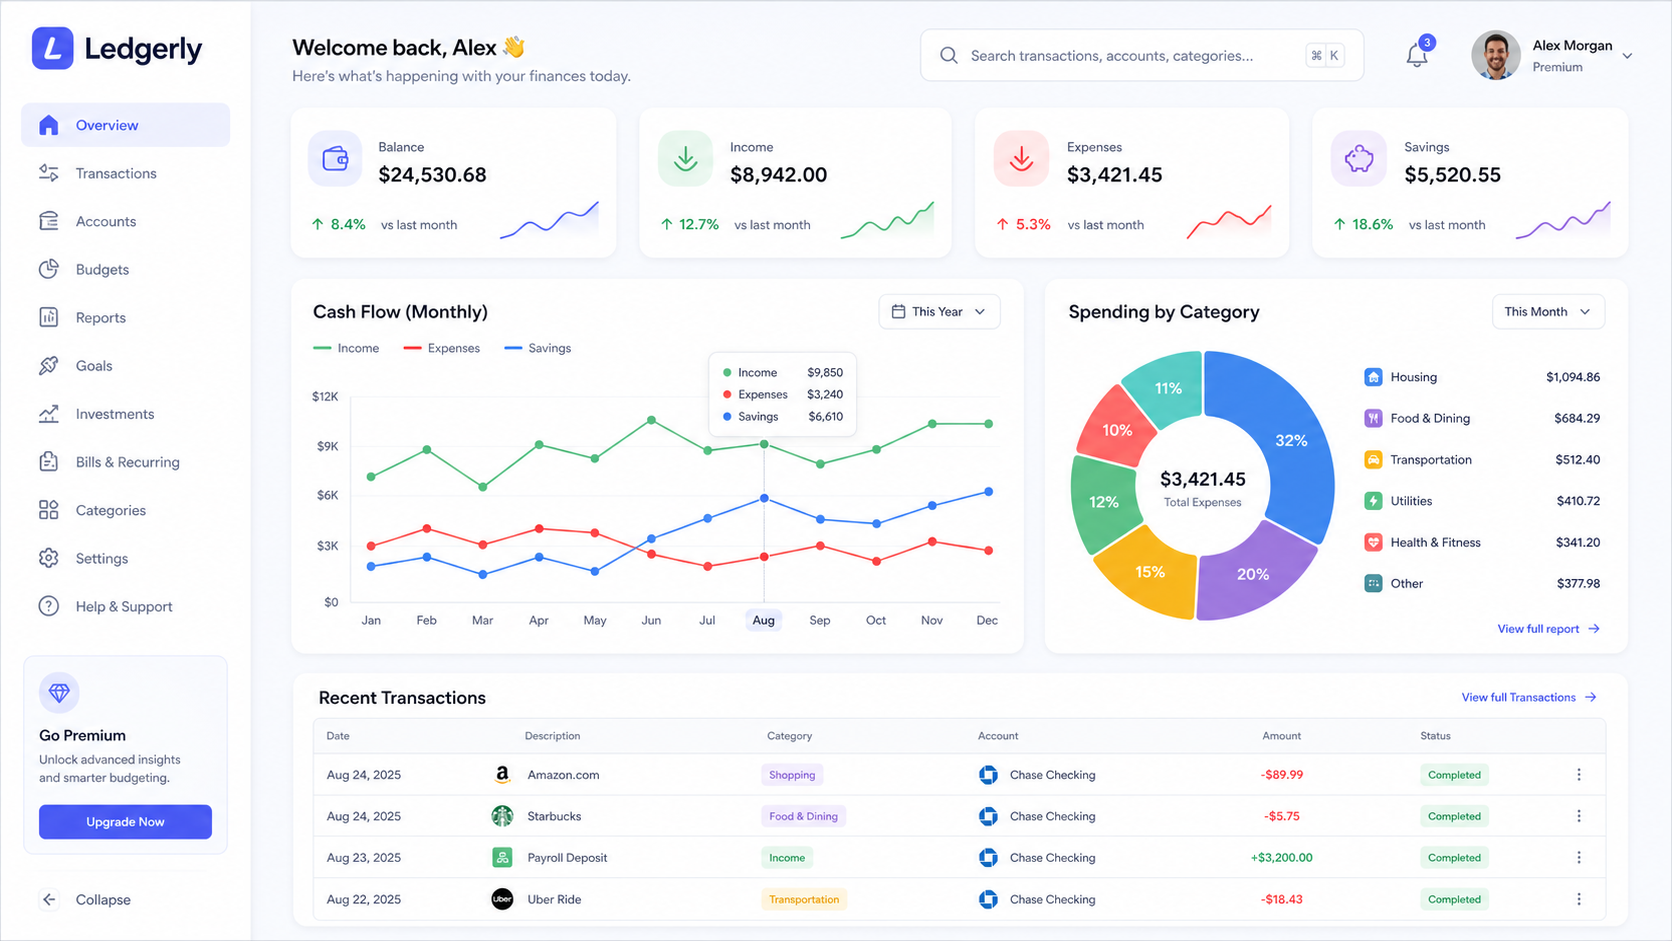
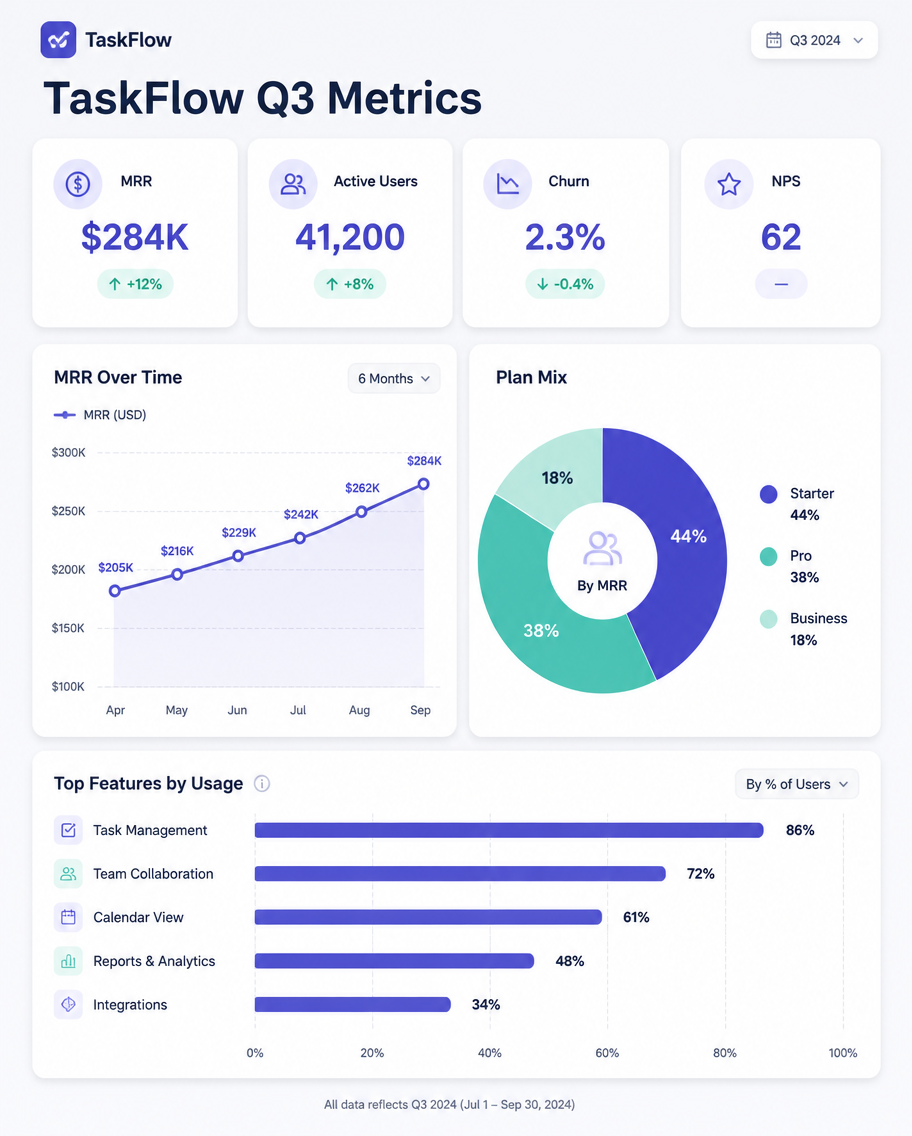
A dashboard-style infographic, 4:5, titled 'TaskFlow Q3 Metrics'. A clean report slide with a top KPI row of four cards: MRR $284K (+12%), Active Users 41,200 (+8%), Churn 2.3% (-0.4%), NPS 62. Below, a two-column layout: left a line chart of revenue climbing over 6 months, right a donut of plan mix (Starter 44%, Pro 38%, Business 18%). A small horizontal bar of top features by usage. Light dashboard-grey background, indigo and mint accents, rounded card widgets, subtle shadows, modern analytics-UI aesthetic, tidy sans-serif.Como usar
- Copie o prompt original completo, incluindo os parâmetros.
- Adapte o tema, o texto e a composição aos seus requisitos.
- Use uma ferramenta externa compatível; confira o acesso e o resultado.
Antes de começar
- Verifique se é necessária uma imagem de referência. Compatibilidade não comprova qual modelo gerou o exemplo.
- Confira nomes, números e textos; os resultados variam entre versões do modelo.