Design illustration · Project Status Report Slide — API Models · CC BY 4.0

Design illustration · Project Status Report Slide — API Models · CC BY 4.0

原文

GPT Image 2 · en

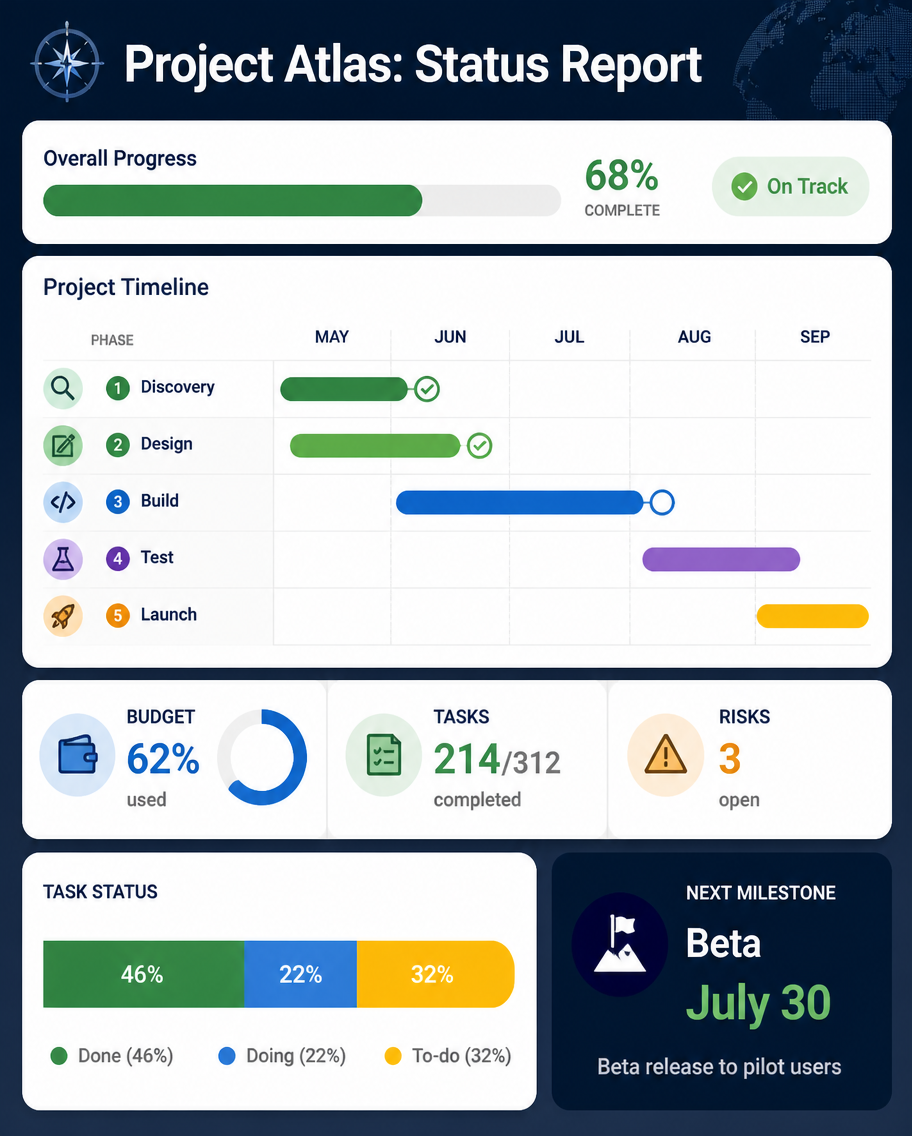
A dashboard infographic, 4:5, titled 'Project Atlas: Status Report'. A management slide: a top progress bar shows 68% complete with an 'On Track' green pill. A mini Gantt chart lists five phases (Discovery done, Design done, Build in progress, Test upcoming, Launch upcoming) with colored timeline bars. Three stat tiles: Budget 62% used, Tasks 214/312, Risks 3 open. A small stacked bar of task status (Done, Doing, To-do) and a next-milestone callout 'Beta July 30'. Clean corporate palette of navy, green, amber, rounded widgets, polished PM-report aesthetic.

使い方

  1. パラメータを含む元のプロンプト全体をコピーします。
  2. 被写体、文字、構図を自分の要件に置き換えます。
  3. 対応する外部ツールで使用し、利用条件と結果を確認します。

開始前の確認

  • 参考画像の要否を確認してください。互換モデルの表示は、そのモデルでの生成実績を意味しません。
  • 名前、数値、画像内の文字を確認します。モデルの版で結果は変わります。
似た事例

Otter Scientist Presentation Slide
GPT Image 2en

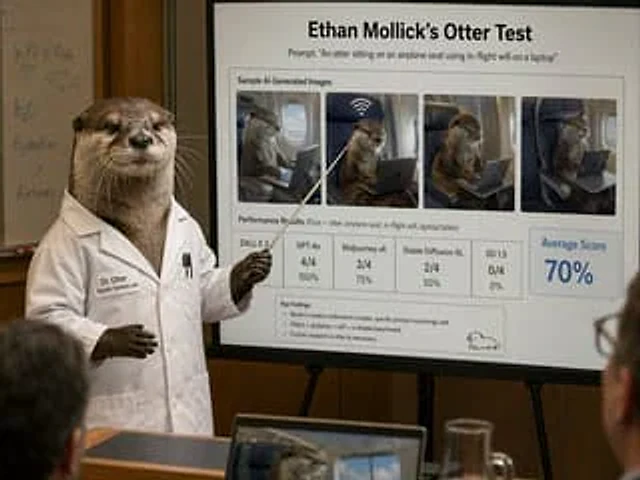
A photorealistic and humorous academic presentation scene takes place in a conference room: an anthropomorphic otter scientist stands on the left side of the frame, dressed in a crisp white lab coat, holding a slender pointer stick and pointing to a large presentation project on

Reasoning Context and Prompt Cache Slide
GPT Image 2en

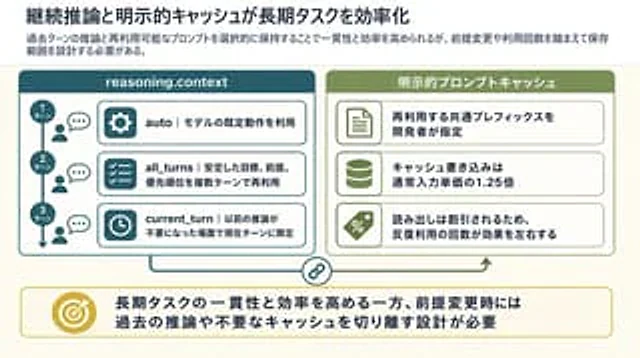
Goal: Create a clean 16:9 Japanese business/technical infographic slide about how continuous reasoning context and explicit prompt caching improve long-running task efficiency. Use a polished PowerPoint-native infographic look with dense but readable explanatory text. Canvas: 16

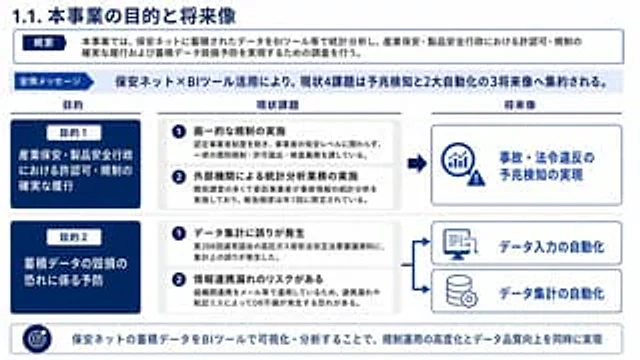
Japanese BI Strategy Slide
GPT Image 2en

Goal: Create a polished Japanese corporate strategy slide about the purpose and future vision of a project using accumulated data from an insurance-safety network and BI tools. Canvas: 16:9 horizontal presentation slide, white background, navy and light-blue corporate palette, t