Design illustration · Project Status Report Slide — API Models · CC BY 4.0

Design illustration · Project Status Report Slide — API Models · CC BY 4.0

원본 문서

GPT Image 2 · en

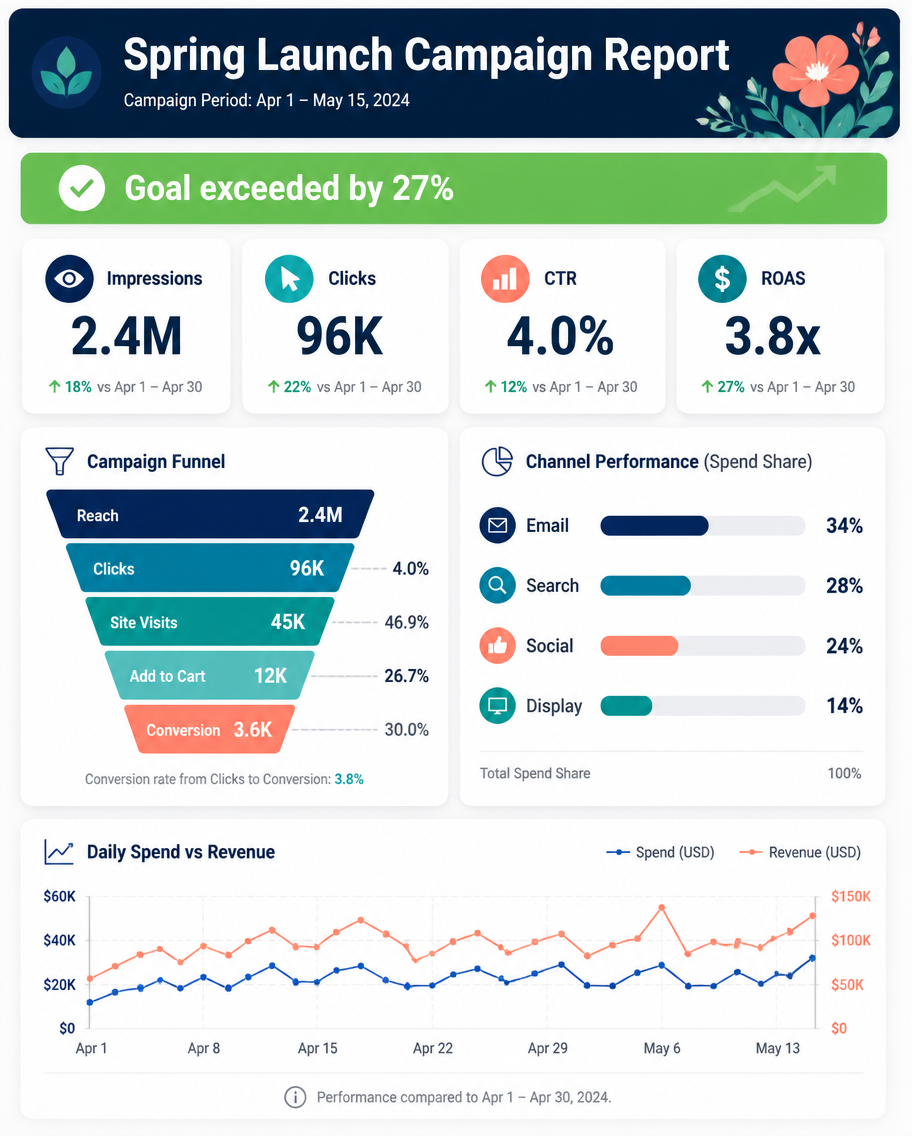
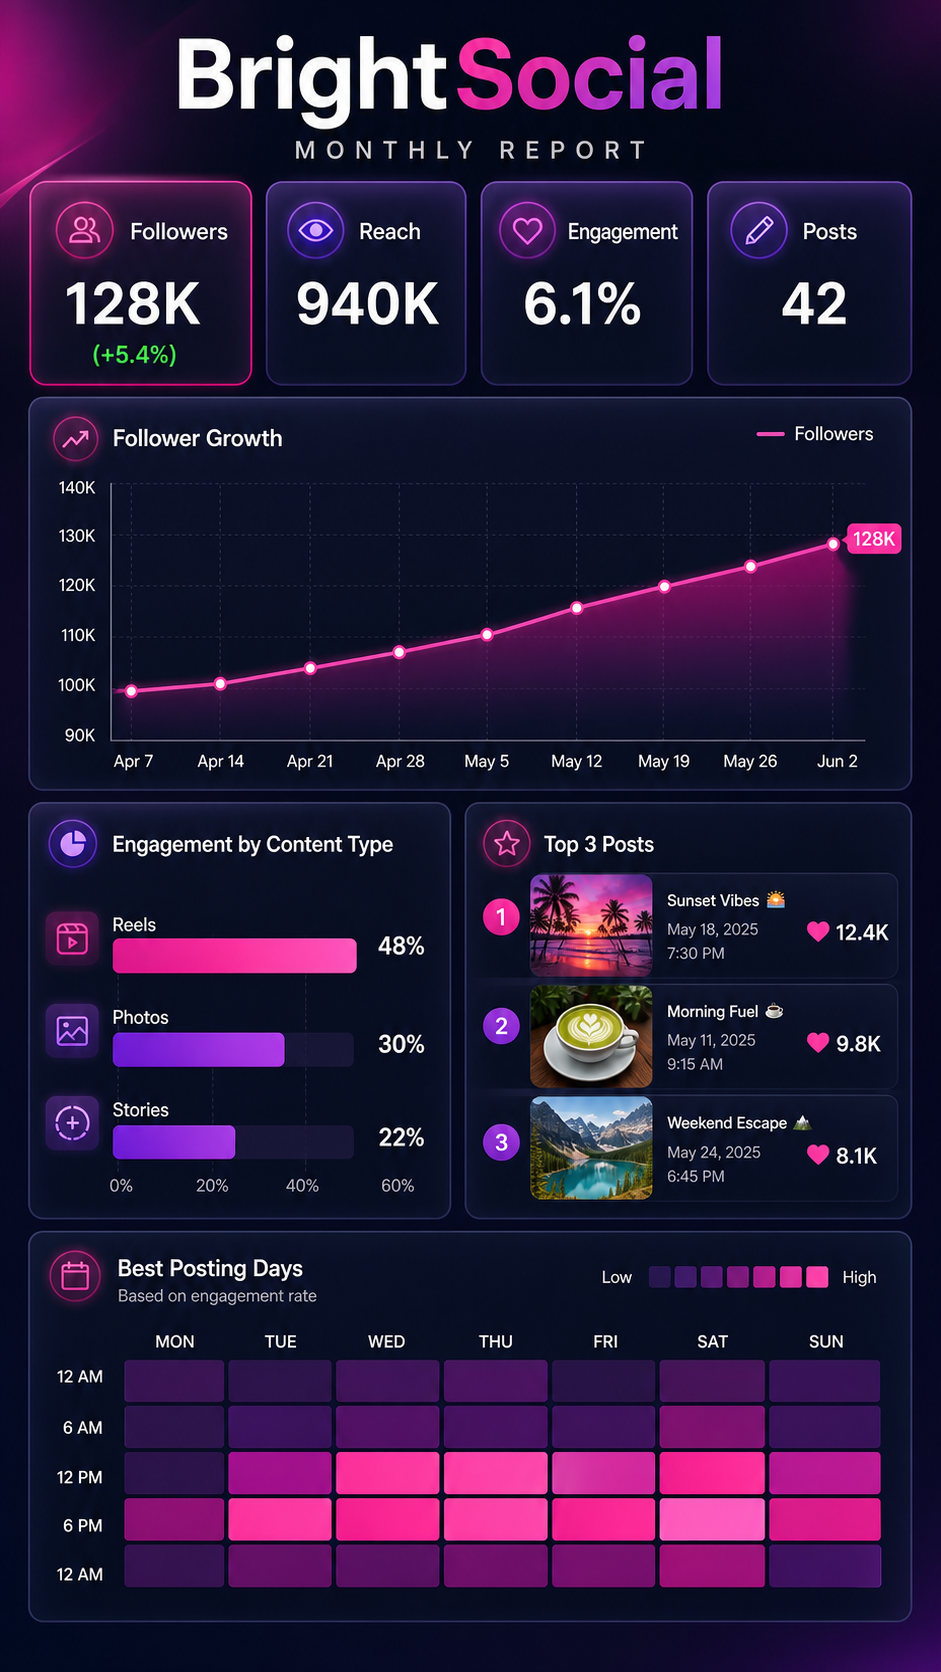
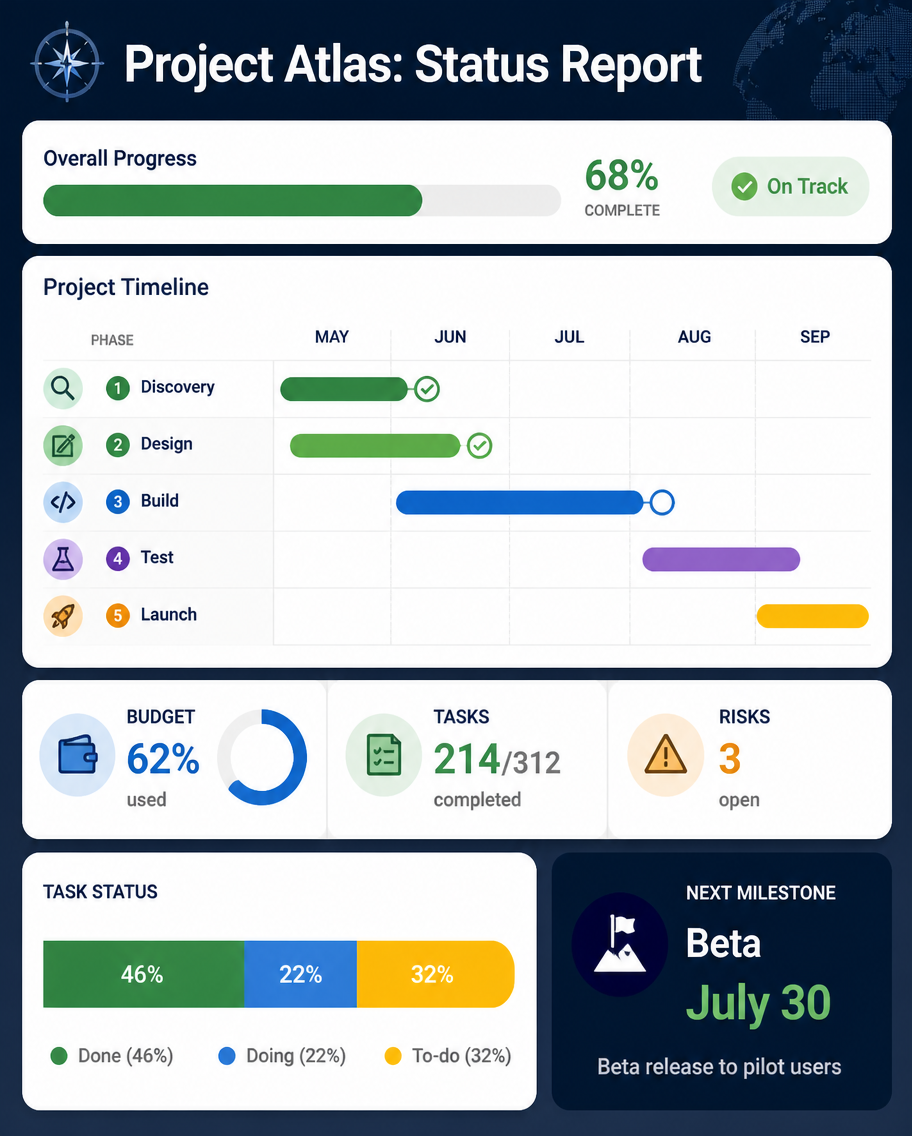
A dashboard infographic, 4:5, titled 'Project Atlas: Status Report'. A management slide: a top progress bar shows 68% complete with an 'On Track' green pill. A mini Gantt chart lists five phases (Discovery done, Design done, Build in progress, Test upcoming, Launch upcoming) with colored timeline bars. Three stat tiles: Budget 62% used, Tasks 214/312, Risks 3 open. A small stacked bar of task status (Done, Doing, To-do) and a next-milestone callout 'Beta July 30'. Clean corporate palette of navy, green, amber, rounded widgets, polished PM-report aesthetic.

사용 방법

  1. 매개변수를 포함한 전체 원본 프롬프트를 복사하세요.
  2. 주제, 문구, 구도를 자신의 요구에 맞게 바꾸세요.
  3. 호환되는 외부 도구에서 사용하고 이용 조건과 결과를 확인하세요.

시작 전 확인

  • 참조 이미지가 필요한지 확인하세요. 호환 표시는 해당 모델로 이 예시를 생성했다는 뜻이 아닙니다.
  • 이름, 수치, 이미지 속 문구를 확인하세요. 모델 버전에 따라 결과가 다를 수 있습니다.
비슷한 예시

Otter Scientist Presentation Slide
GPT Image 2en

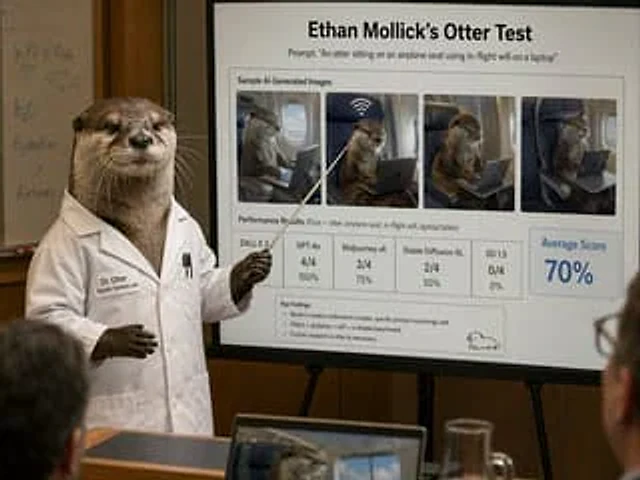
A photorealistic and humorous academic presentation scene takes place in a conference room: an anthropomorphic otter scientist stands on the left side of the frame, dressed in a crisp white lab coat, holding a slender pointer stick and pointing to a large presentation project on

Reasoning Context and Prompt Cache Slide
GPT Image 2en

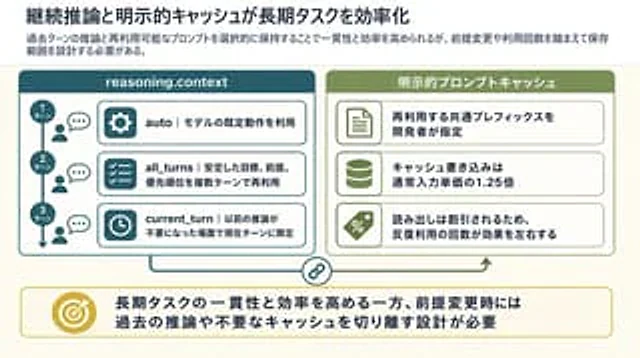
Goal: Create a clean 16:9 Japanese business/technical infographic slide about how continuous reasoning context and explicit prompt caching improve long-running task efficiency. Use a polished PowerPoint-native infographic look with dense but readable explanatory text. Canvas: 16

Japanese BI Strategy Slide
GPT Image 2en

Goal: Create a polished Japanese corporate strategy slide about the purpose and future vision of a project using accumulated data from an insurance-safety network and BI tools. Canvas: 16:9 horizontal presentation slide, white background, navy and light-blue corporate palette, t