原始文档
GPT Image 2 · en
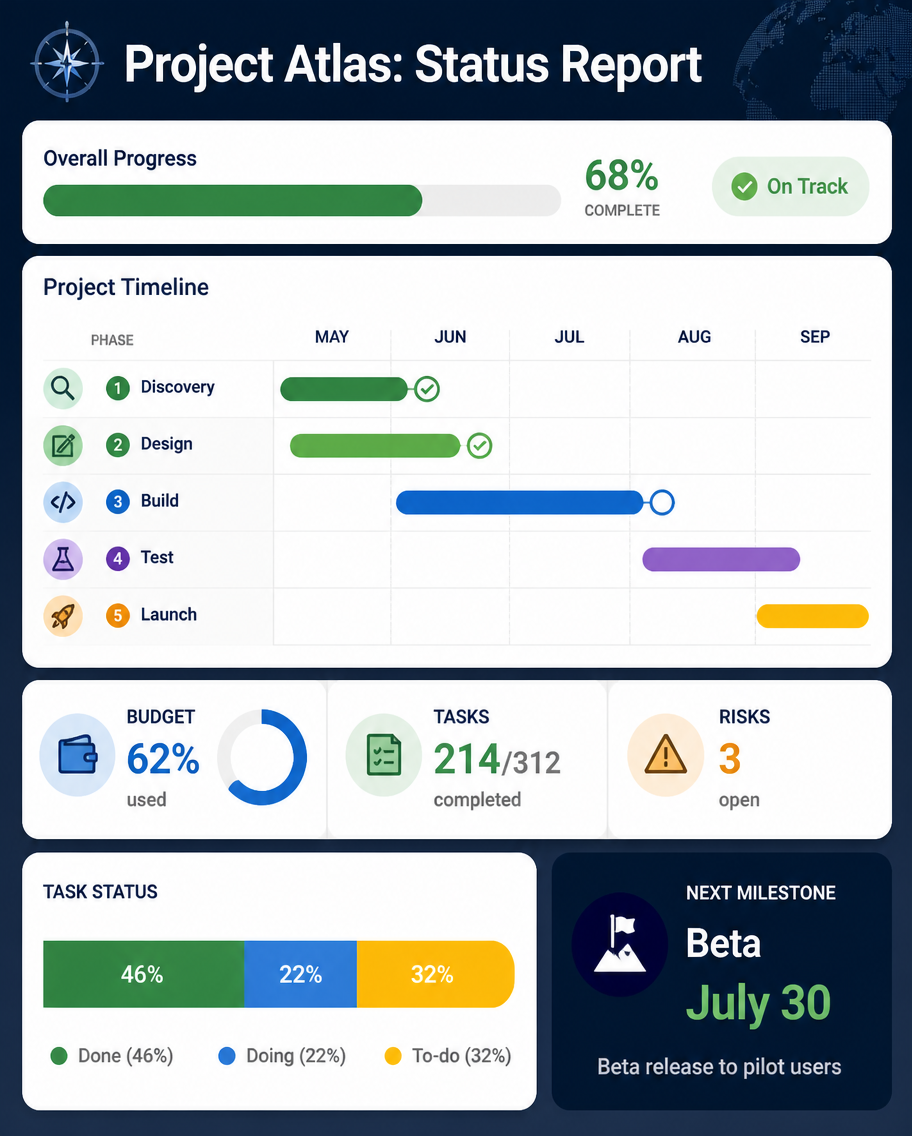
A dashboard infographic, 4:5, titled 'Project Atlas: Status Report'. A management slide: a top progress bar shows 68% complete with an 'On Track' green pill. A mini Gantt chart lists five phases (Discovery done, Design done, Build in progress, Test upcoming, Launch upcoming) with colored timeline bars. Three stat tiles: Budget 62% used, Tasks 214/312, Risks 3 open. A small stacked bar of task status (Done, Doing, To-do) and a next-milestone callout 'Beta July 30'. Clean corporate palette of navy, green, amber, rounded widgets, polished PM-report aesthetic.使用方法
- 复制完整原始提示词,并保留其中的参数。
- 按需求替换主体、文字和构图要求。
- 在兼容的外部工具中使用,核对当前使用条件并检查结果。
开始前需了解
- 先确认是否需要参考图。标注兼容模型,不代表该示例由这个模型生成。
- 核对名称、数字与画面文字;不同模型版本的结果可能不同。