Original document
GPT Image 2 · en
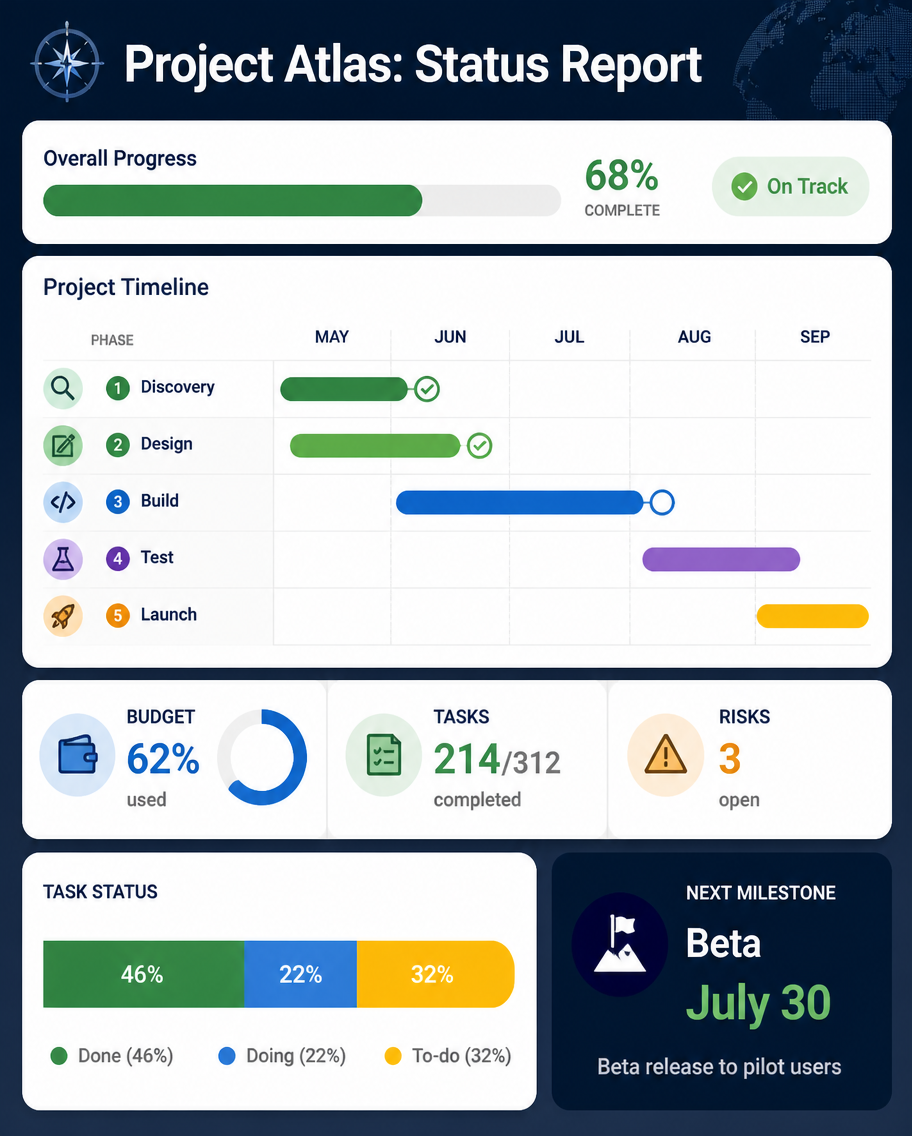
A dashboard infographic, 4:5, titled 'Project Atlas: Status Report'. A management slide: a top progress bar shows 68% complete with an 'On Track' green pill. A mini Gantt chart lists five phases (Discovery done, Design done, Build in progress, Test upcoming, Launch upcoming) with colored timeline bars. Three stat tiles: Budget 62% used, Tasks 214/312, Risks 3 open. A small stacked bar of task status (Done, Doing, To-do) and a next-milestone callout 'Beta July 30'. Clean corporate palette of navy, green, amber, rounded widgets, polished PM-report aesthetic.How to use
- Copy the complete original prompt, including any parameters.
- Replace the subject, text and composition with your own requirements.
- Use a compatible external tool; check its current access conditions and review the result.
Before you start
- Check whether a reference image is required. A compatible model label does not mean this example was generated with that model.
- Keep names, figures and visible text accurate; results can vary between model versions.