원본 문서
GPT Image 2 · en
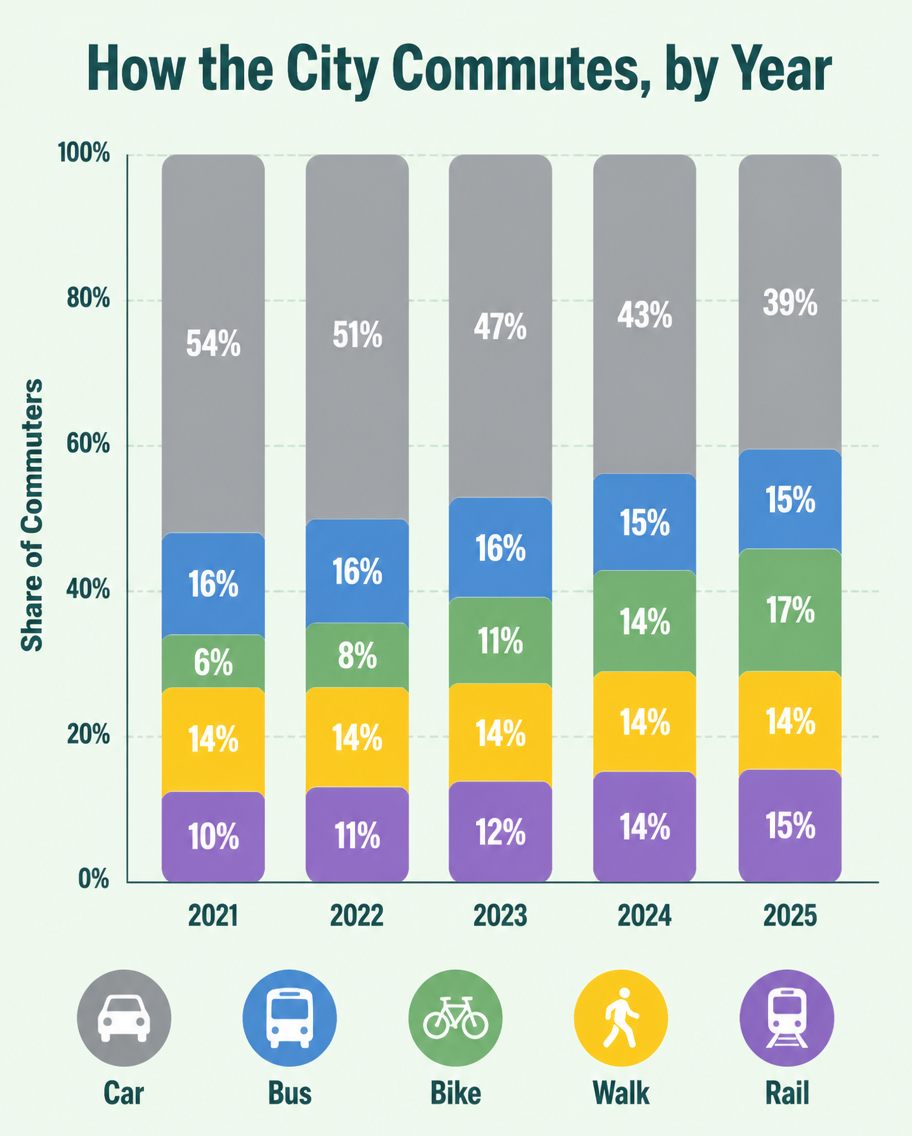
A flat infographic, 4:5, titled 'How the City Commutes, by Year'. A vertical stacked bar chart with five bars (2021-2025), each divided into Car (grey), Bus (blue), Bike (green), Walk (yellow), Rail (purple). Over the years the grey car segment shrinks from 54% to 39% while green bike grows from 6% to 17%. Percentage labels inside each segment, a tidy legend row at the bottom with transport icons. Soft mint background, rounded bar corners, clean geometric sans type, subtle grid lines behind bars.사용 방법
- 매개변수를 포함한 전체 원본 프롬프트를 복사하세요.
- 주제, 문구, 구도를 자신의 요구에 맞게 바꾸세요.
- 호환되는 외부 도구에서 사용하고 이용 조건과 결과를 확인하세요.
시작 전 확인
- 참조 이미지가 필요한지 확인하세요. 호환 표시는 해당 모델로 이 예시를 생성했다는 뜻이 아닙니다.
- 이름, 수치, 이미지 속 문구를 확인하세요. 모델 버전에 따라 결과가 다를 수 있습니다.