原始文档
GPT Image 2 · en
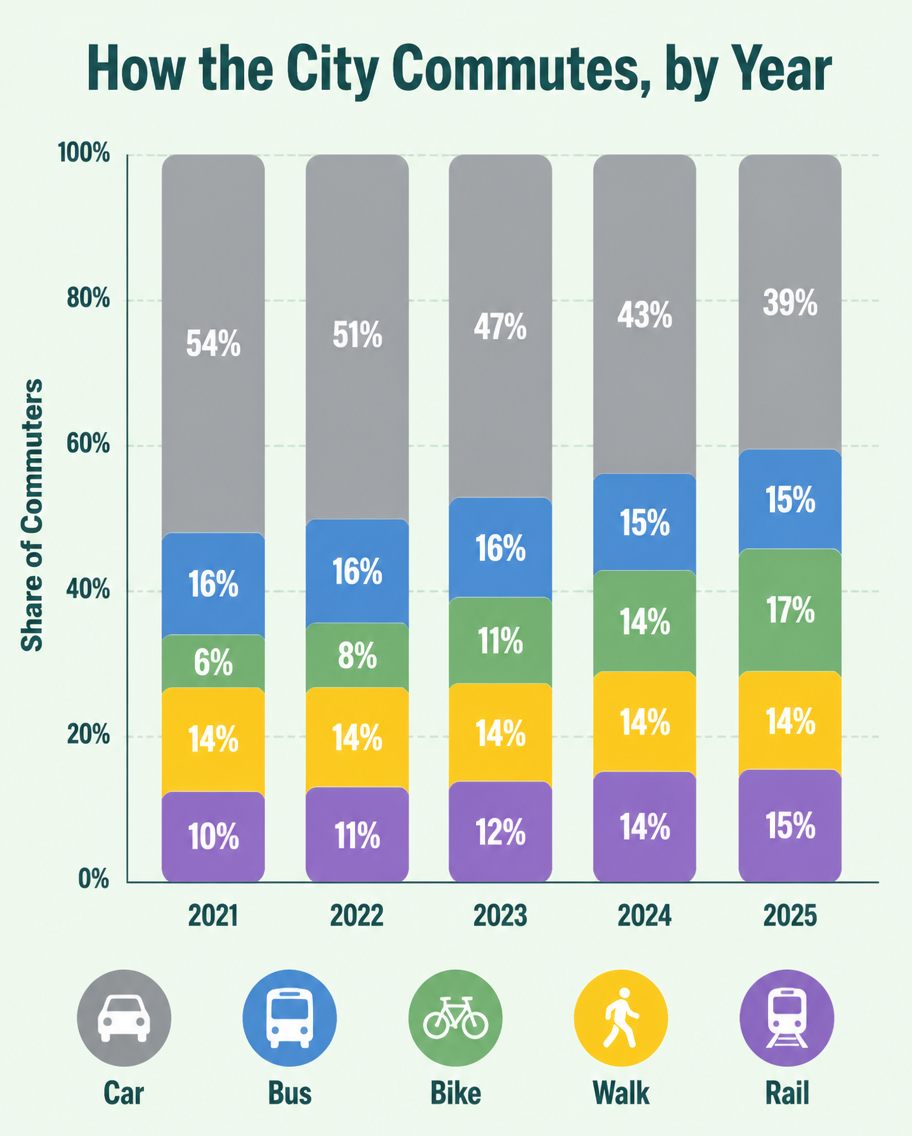
A flat infographic, 4:5, titled 'How the City Commutes, by Year'. A vertical stacked bar chart with five bars (2021-2025), each divided into Car (grey), Bus (blue), Bike (green), Walk (yellow), Rail (purple). Over the years the grey car segment shrinks from 54% to 39% while green bike grows from 6% to 17%. Percentage labels inside each segment, a tidy legend row at the bottom with transport icons. Soft mint background, rounded bar corners, clean geometric sans type, subtle grid lines behind bars.使用方法
- 复制完整原始提示词,并保留其中的参数。
- 按需求替换主体、文字和构图要求。
- 在兼容的外部工具中使用,核对当前使用条件并检查结果。
开始前需了解
- 先确认是否需要参考图。标注兼容模型,不代表该示例由这个模型生成。
- 核对名称、数字与画面文字;不同模型版本的结果可能不同。