Oryginalny dokument
GPT Image 2 · en
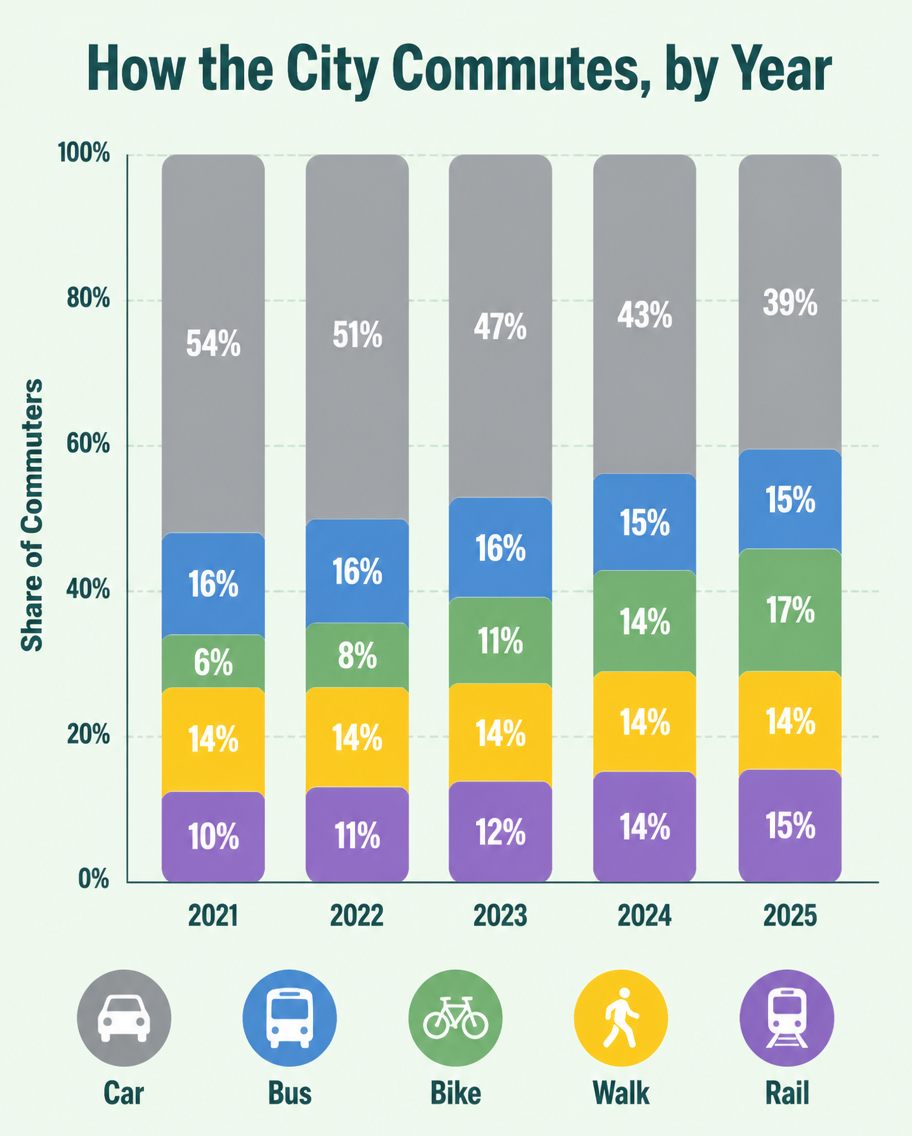
A flat infographic, 4:5, titled 'How the City Commutes, by Year'. A vertical stacked bar chart with five bars (2021-2025), each divided into Car (grey), Bus (blue), Bike (green), Walk (yellow), Rail (purple). Over the years the grey car segment shrinks from 54% to 39% while green bike grows from 6% to 17%. Percentage labels inside each segment, a tidy legend row at the bottom with transport icons. Soft mint background, rounded bar corners, clean geometric sans type, subtle grid lines behind bars.Jak używać
- Skopiuj cały oryginalny prompt wraz z parametrami.
- Dostosuj temat, tekst i kompozycję do swoich potrzeb.
- Użyj zgodnego narzędzia zewnętrznego; sprawdź warunki dostępu i wynik.
Przed rozpoczęciem
- Sprawdź, czy potrzebny jest obraz referencyjny. Zgodność nie potwierdza modelu użytego do przykładu.
- Sprawdź nazwy, liczby i napisy; wyniki zależą od wersji modelu.