Original document
GPT Image 2 · en
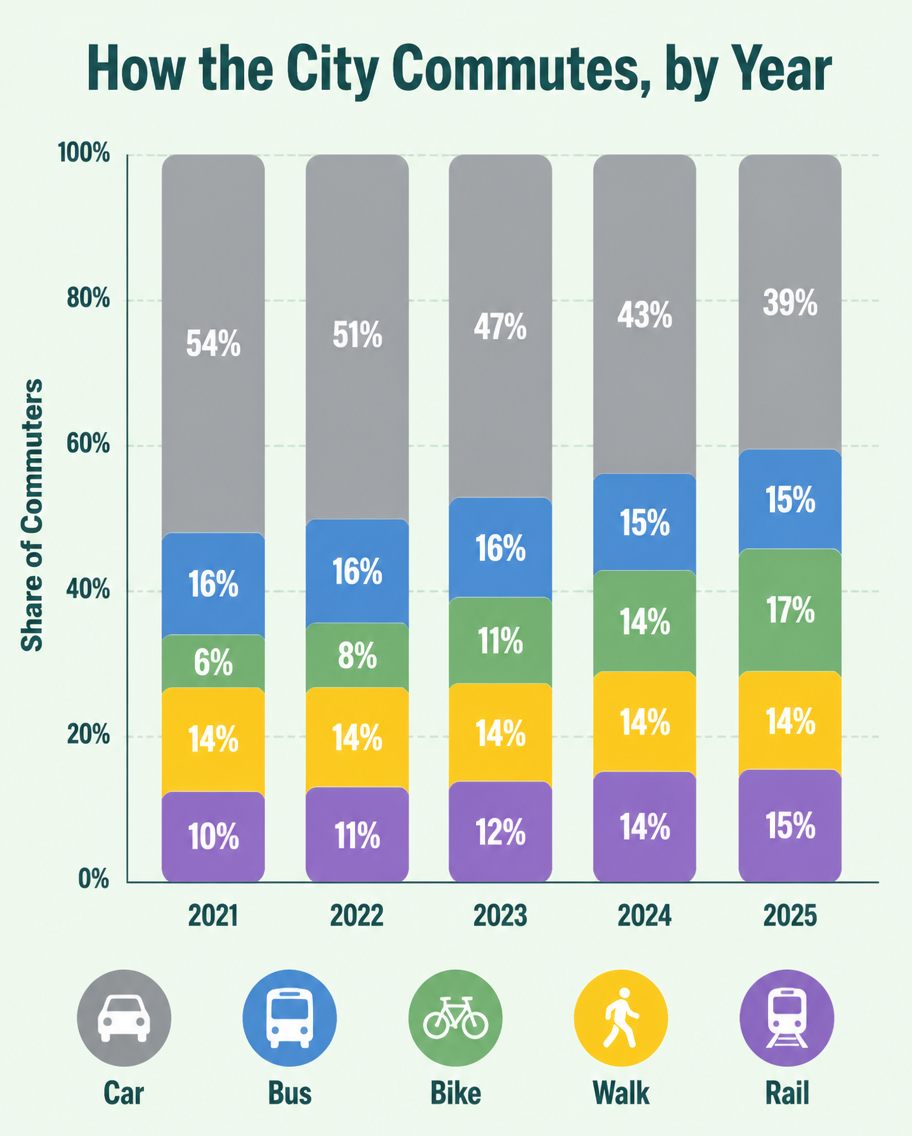
A flat infographic, 4:5, titled 'How the City Commutes, by Year'. A vertical stacked bar chart with five bars (2021-2025), each divided into Car (grey), Bus (blue), Bike (green), Walk (yellow), Rail (purple). Over the years the grey car segment shrinks from 54% to 39% while green bike grows from 6% to 17%. Percentage labels inside each segment, a tidy legend row at the bottom with transport icons. Soft mint background, rounded bar corners, clean geometric sans type, subtle grid lines behind bars.How to use
- Copy the complete original prompt, including any parameters.
- Replace the subject, text and composition with your own requirements.
- Use a compatible external tool; check its current access conditions and review the result.
Before you start
- Check whether a reference image is required. A compatible model label does not mean this example was generated with that model.
- Keep names, figures and visible text accurate; results can vary between model versions.