Documento originale
GPT Image 2 · en
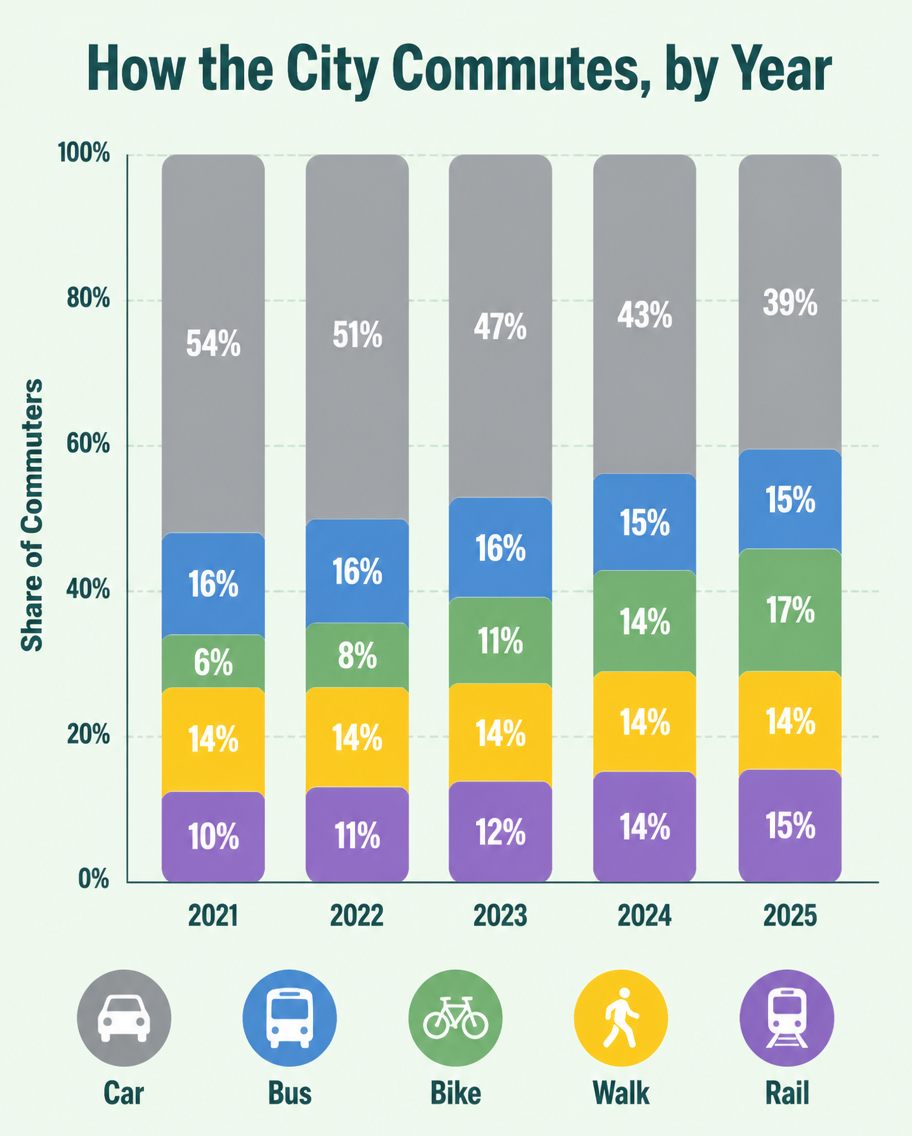
A flat infographic, 4:5, titled 'How the City Commutes, by Year'. A vertical stacked bar chart with five bars (2021-2025), each divided into Car (grey), Bus (blue), Bike (green), Walk (yellow), Rail (purple). Over the years the grey car segment shrinks from 54% to 39% while green bike grows from 6% to 17%. Percentage labels inside each segment, a tidy legend row at the bottom with transport icons. Soft mint background, rounded bar corners, clean geometric sans type, subtle grid lines behind bars.Come usare
- Copia tutto il prompt originale, inclusi i parametri.
- Adatta soggetto, testo e composizione alle tue esigenze.
- Usa uno strumento esterno compatibile; verifica accesso e risultato.
Prima di iniziare
- Controlla se serve un’immagine di riferimento. La compatibilità non prova il modello usato per l’esempio.
- Verifica nomi, numeri e testi; i risultati cambiano con le versioni del modello.