원본 문서
GPT Image 2 · en
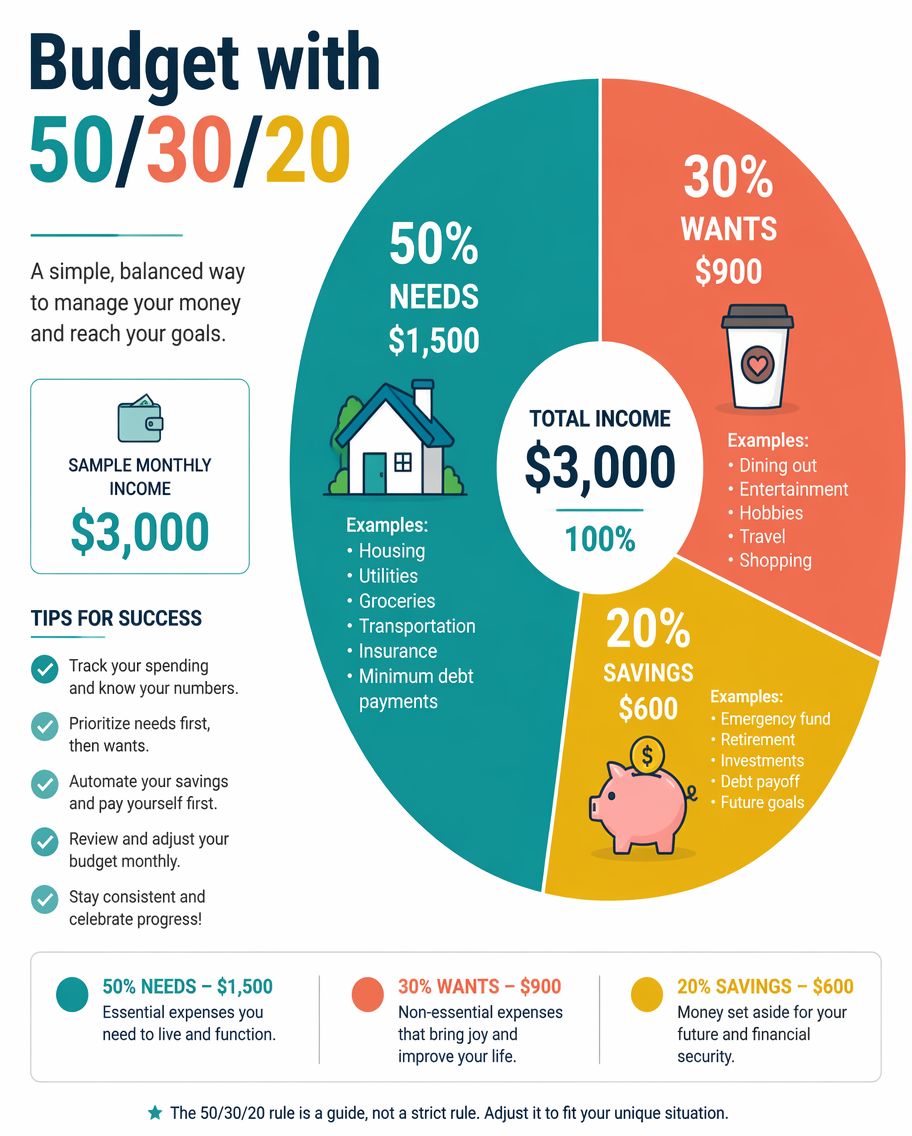
A personal-finance infographic explaining the 50/30/20 budgeting rule as a large donut chart split into three wedges - 50% needs, 30% wants, 20% savings - each labeled with example categories and icons (a house, a coffee cup, a piggy bank). A sample monthly income of $3,000 shows the dollar split beside each slice. Clean modern flat style, a teal, coral and gold palette on white. Bold title 'Budget with 50/30/20' upper-left, a small checklist of tips and a legend along the base.사용 방법
- 매개변수를 포함한 전체 원본 프롬프트를 복사하세요.
- 주제, 문구, 구도를 자신의 요구에 맞게 바꾸세요.
- 호환되는 외부 도구에서 사용하고 이용 조건과 결과를 확인하세요.
시작 전 확인
- 참조 이미지가 필요한지 확인하세요. 호환 표시는 해당 모델로 이 예시를 생성했다는 뜻이 아닙니다.
- 이름, 수치, 이미지 속 문구를 확인하세요. 모델 버전에 따라 결과가 다를 수 있습니다.