原始文档
GPT Image 2 · en
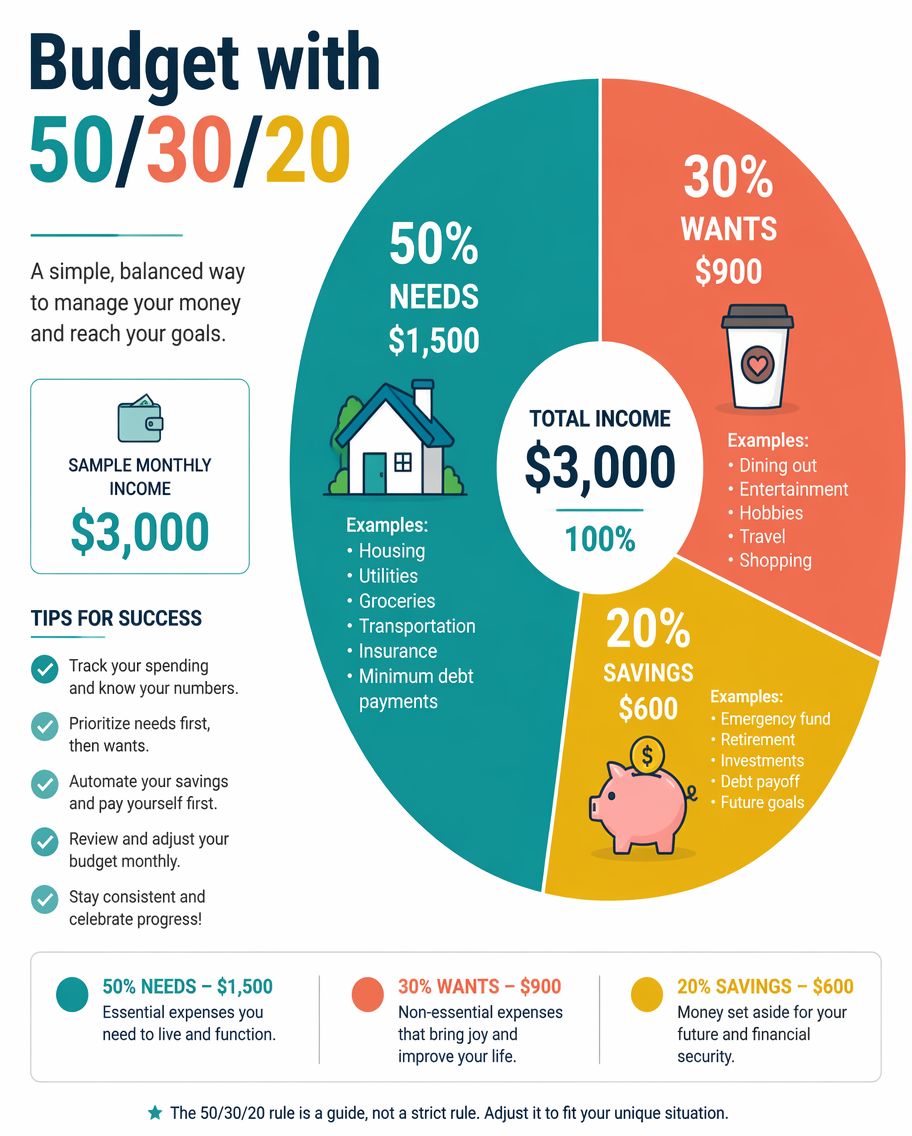
A personal-finance infographic explaining the 50/30/20 budgeting rule as a large donut chart split into three wedges - 50% needs, 30% wants, 20% savings - each labeled with example categories and icons (a house, a coffee cup, a piggy bank). A sample monthly income of $3,000 shows the dollar split beside each slice. Clean modern flat style, a teal, coral and gold palette on white. Bold title 'Budget with 50/30/20' upper-left, a small checklist of tips and a legend along the base.使用方法
- 复制完整原始提示词,并保留其中的参数。
- 按需求替换主体、文字和构图要求。
- 在兼容的外部工具中使用,核对当前使用条件并检查结果。
开始前需了解
- 先确认是否需要参考图。标注兼容模型,不代表该示例由这个模型生成。
- 核对名称、数字与画面文字;不同模型版本的结果可能不同。