Original document
GPT Image 2 · en
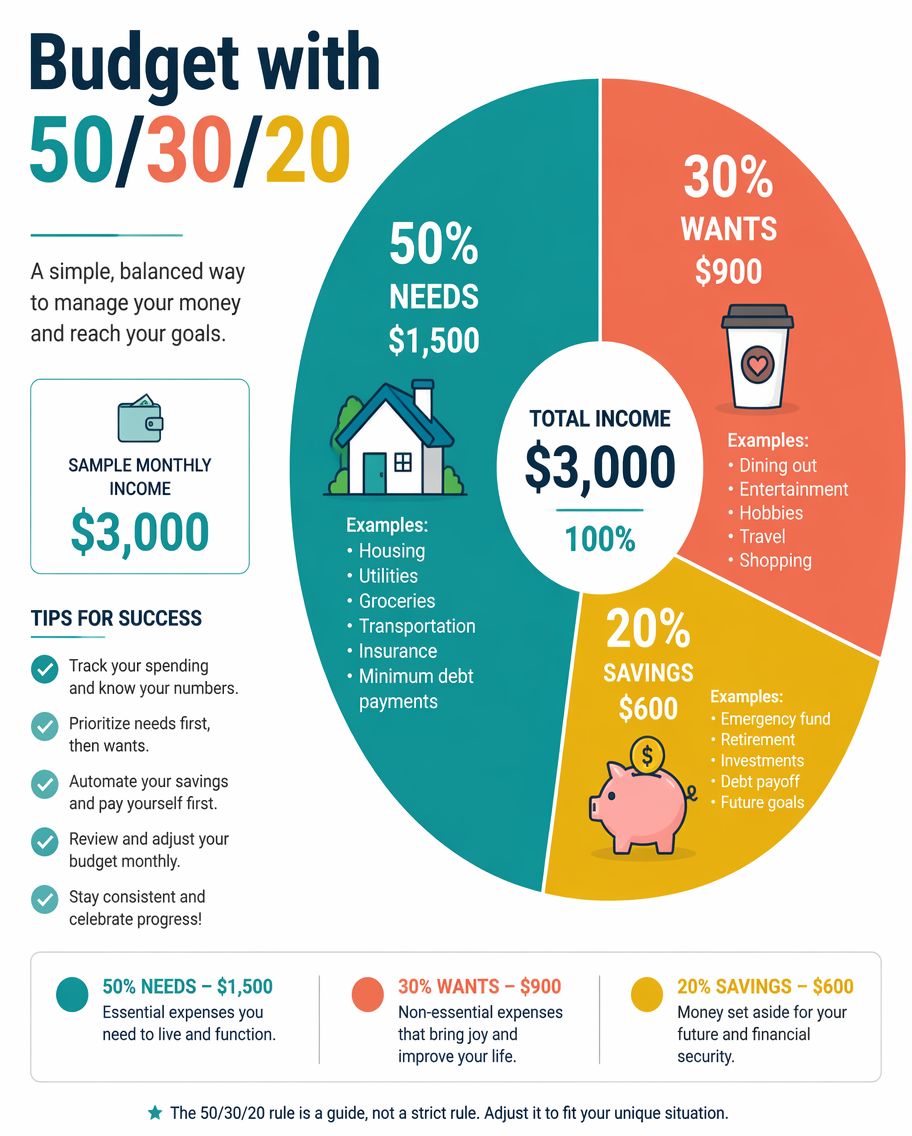
A personal-finance infographic explaining the 50/30/20 budgeting rule as a large donut chart split into three wedges - 50% needs, 30% wants, 20% savings - each labeled with example categories and icons (a house, a coffee cup, a piggy bank). A sample monthly income of $3,000 shows the dollar split beside each slice. Clean modern flat style, a teal, coral and gold palette on white. Bold title 'Budget with 50/30/20' upper-left, a small checklist of tips and a legend along the base.How to use
- Copy the complete original prompt, including any parameters.
- Replace the subject, text and composition with your own requirements.
- Use a compatible external tool; check its current access conditions and review the result.
Before you start
- Check whether a reference image is required. A compatible model label does not mean this example was generated with that model.
- Keep names, figures and visible text accurate; results can vary between model versions.