Design illustration · Fitness App Weekly Report — API Models · CC BY 4.0

Design illustration · Fitness App Weekly Report — API Models · CC BY 4.0

원본 문서

GPT Image 2 · en

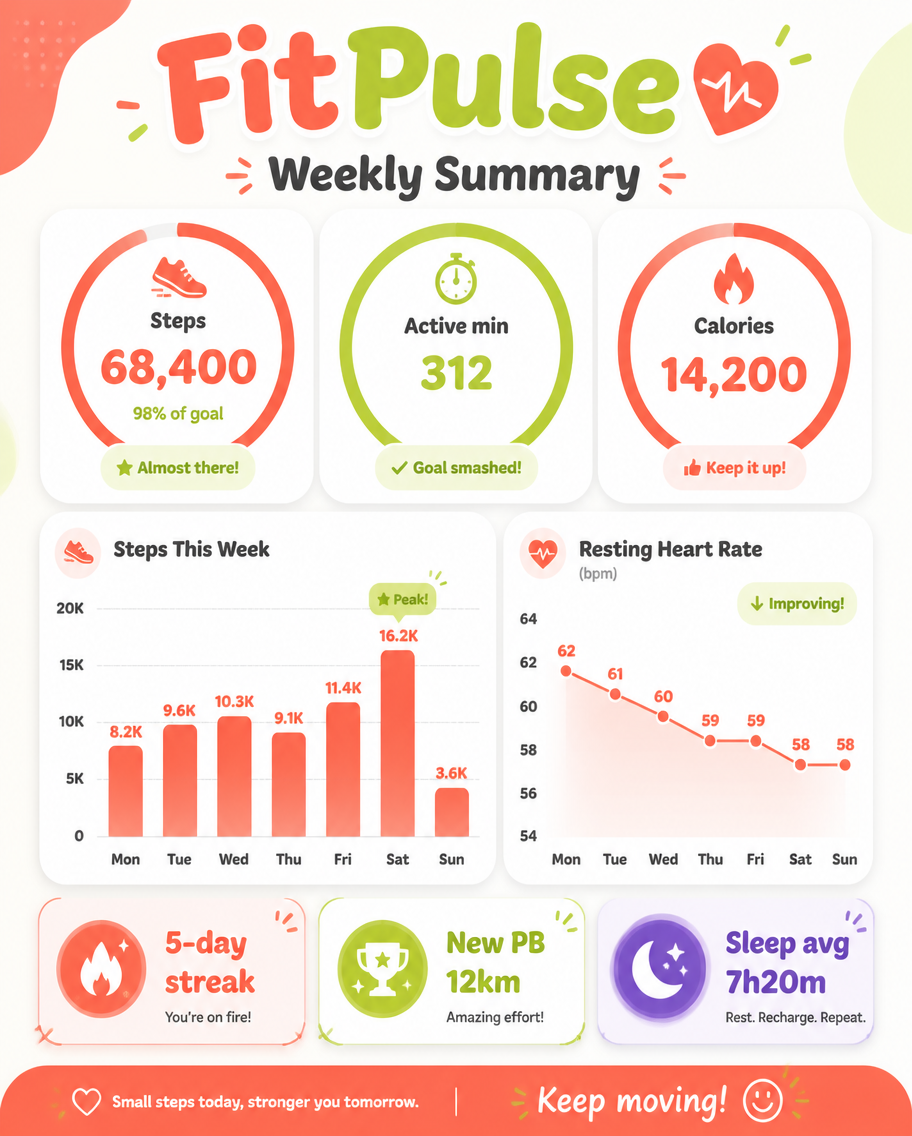
A dashboard infographic, 4:5, titled 'FitPulse Weekly Summary'. A friendly report slide: a top ring-chart trio shows Steps 68,400 (98% of goal), Active min 312, Calories 14,200. A weekly bar chart plots steps Mon-Sun peaking Saturday, a small line shows resting heart rate trending down 62-58 bpm, and three badge chips: '5-day streak', 'New PB 12km', 'Sleep avg 7h20m'. Energetic coral, lime, and white palette, rounded progress rings, soft shadows, motivating clean fitness-app dashboard aesthetic, bubbly headings.

사용 방법

  1. 매개변수를 포함한 전체 원본 프롬프트를 복사하세요.
  2. 주제, 문구, 구도를 자신의 요구에 맞게 바꾸세요.
  3. 호환되는 외부 도구에서 사용하고 이용 조건과 결과를 확인하세요.

시작 전 확인

  • 참조 이미지가 필요한지 확인하세요. 호환 표시는 해당 모델로 이 예시를 생성했다는 뜻이 아닙니다.
  • 이름, 수치, 이미지 속 문구를 확인하세요. 모델 버전에 따라 결과가 다를 수 있습니다.
비슷한 예시

Fitness SaaS Landing Page UI
GPT Image 2en

Design a modern, high-end{argument name="app type" default="Fitness app"} Landing page and product UI, brand name is{argument name="brand name" default="PulseFit"} Create a clean web design mockup that resembles a legitimate SaaS fitness platform and its accompanying mobile app.

Leaked AI Benchmark Report Photo
GPT Image 2en

{ "type": "Photograph of a computer monitor displaying academic and technical reports.", "style": "Slightly tilted screen photo, showing moiré patterns, LCD pixel grid, slight reflections, LaTeX document layout, serif font.", "document_header": { "left": "4. Benchmark A