Oryginalny dokument
GPT Image 2 · en
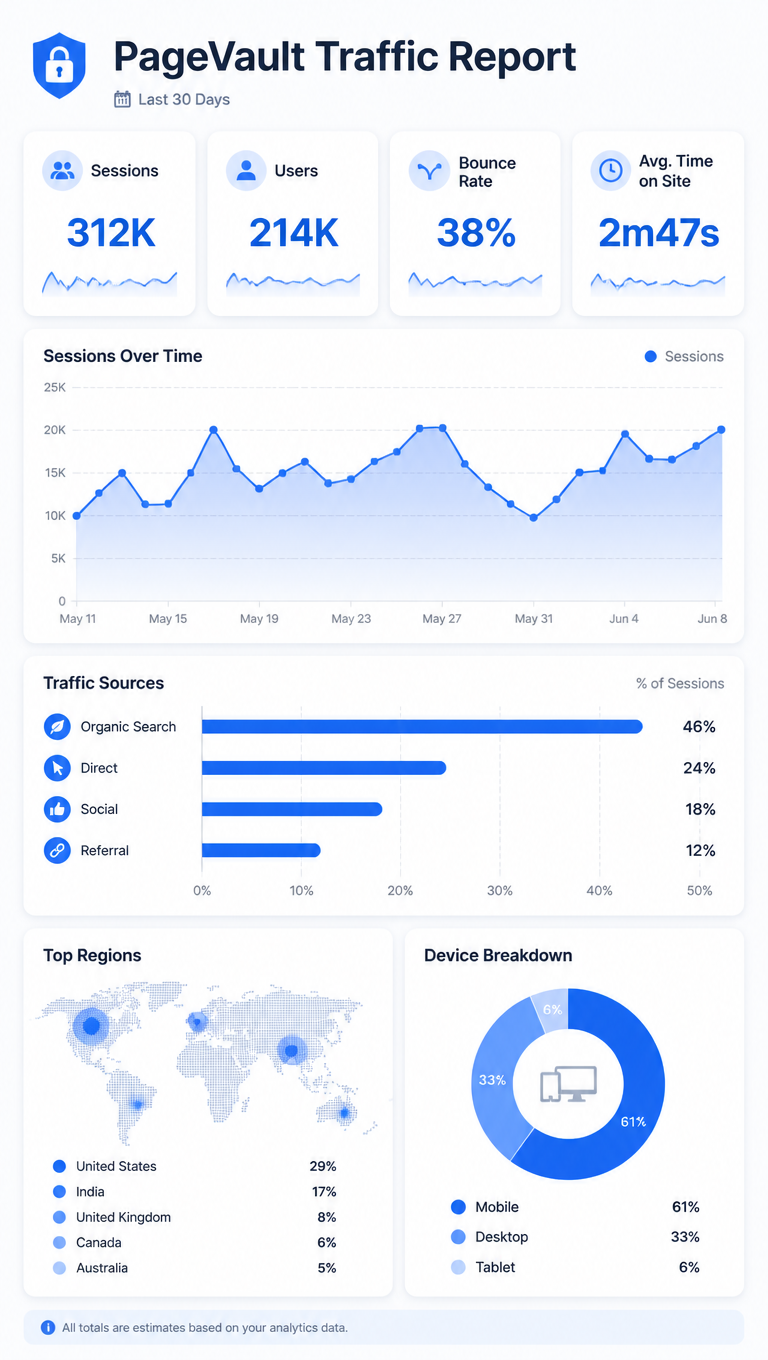
A dashboard infographic, 9:16, titled 'PageVault Traffic Report'. A vertical analytics slide: top tiles show Sessions 312K, Users 214K, Bounce 38%, Avg Time 2m47s. An area chart plots daily sessions over 30 days, a horizontal bar ranks traffic sources (Organic 46%, Direct 24%, Social 18%, Referral 12%), and a small world-map dot cluster highlights top regions. A device-split mini donut (Mobile 61%, Desktop 33%, Tablet 6%). Cool blue-and-white palette, rounded card widgets, faint grid, clean modern web-analytics dashboard aesthetic.Jak używać
- Skopiuj cały oryginalny prompt wraz z parametrami.
- Dostosuj temat, tekst i kompozycję do swoich potrzeb.
- Użyj zgodnego narzędzia zewnętrznego; sprawdź warunki dostępu i wynik.
Przed rozpoczęciem
- Sprawdź, czy potrzebny jest obraz referencyjny. Zgodność nie potwierdza modelu użytego do przykładu.
- Sprawdź nazwy, liczby i napisy; wyniki zależą od wersji modelu.