Documento originale
GPT Image 2 · en
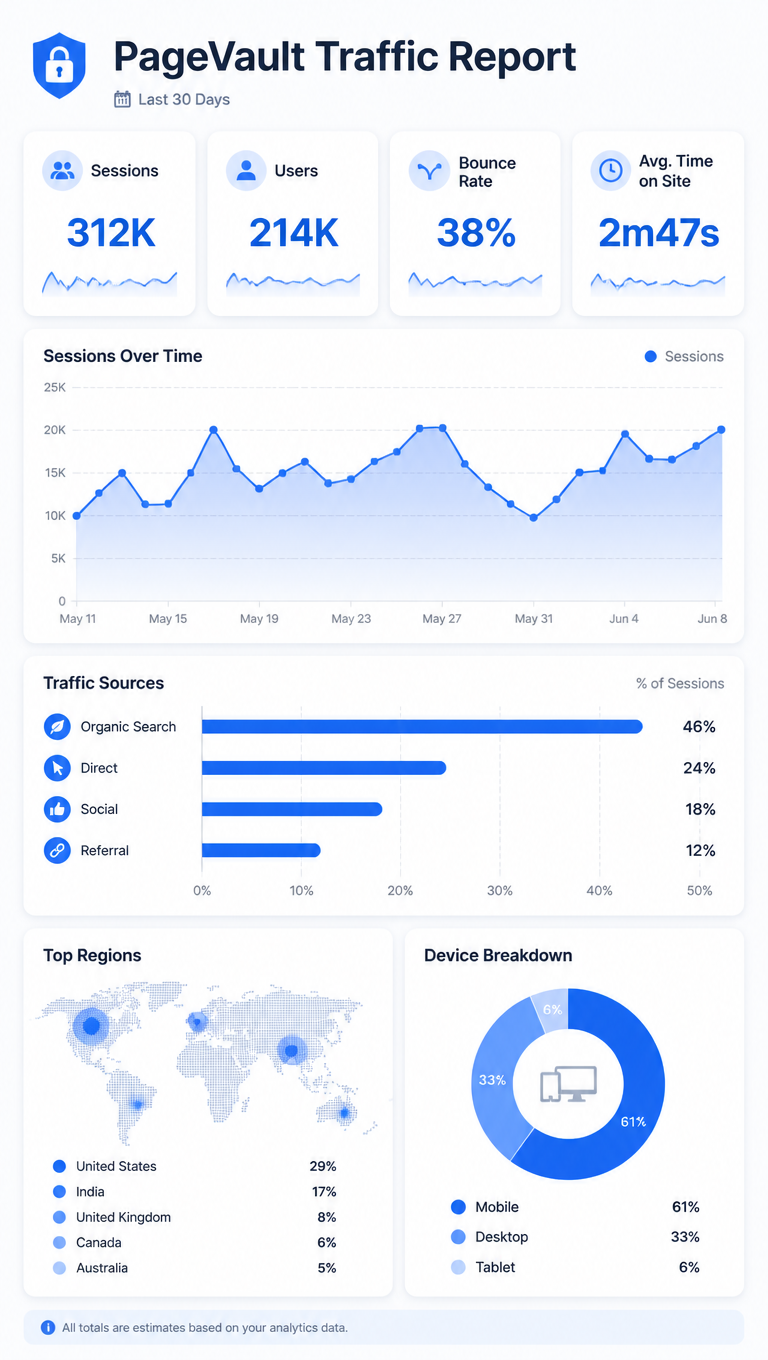
A dashboard infographic, 9:16, titled 'PageVault Traffic Report'. A vertical analytics slide: top tiles show Sessions 312K, Users 214K, Bounce 38%, Avg Time 2m47s. An area chart plots daily sessions over 30 days, a horizontal bar ranks traffic sources (Organic 46%, Direct 24%, Social 18%, Referral 12%), and a small world-map dot cluster highlights top regions. A device-split mini donut (Mobile 61%, Desktop 33%, Tablet 6%). Cool blue-and-white palette, rounded card widgets, faint grid, clean modern web-analytics dashboard aesthetic.Come usare
- Copia tutto il prompt originale, inclusi i parametri.
- Adatta soggetto, testo e composizione alle tue esigenze.
- Usa uno strumento esterno compatibile; verifica accesso e risultato.
Prima di iniziare
- Controlla se serve un’immagine di riferimento. La compatibilità non prova il modello usato per l’esempio.
- Verifica nomi, numeri e testi; i risultati cambiano con le versioni del modello.