Original document
GPT Image 2 · en
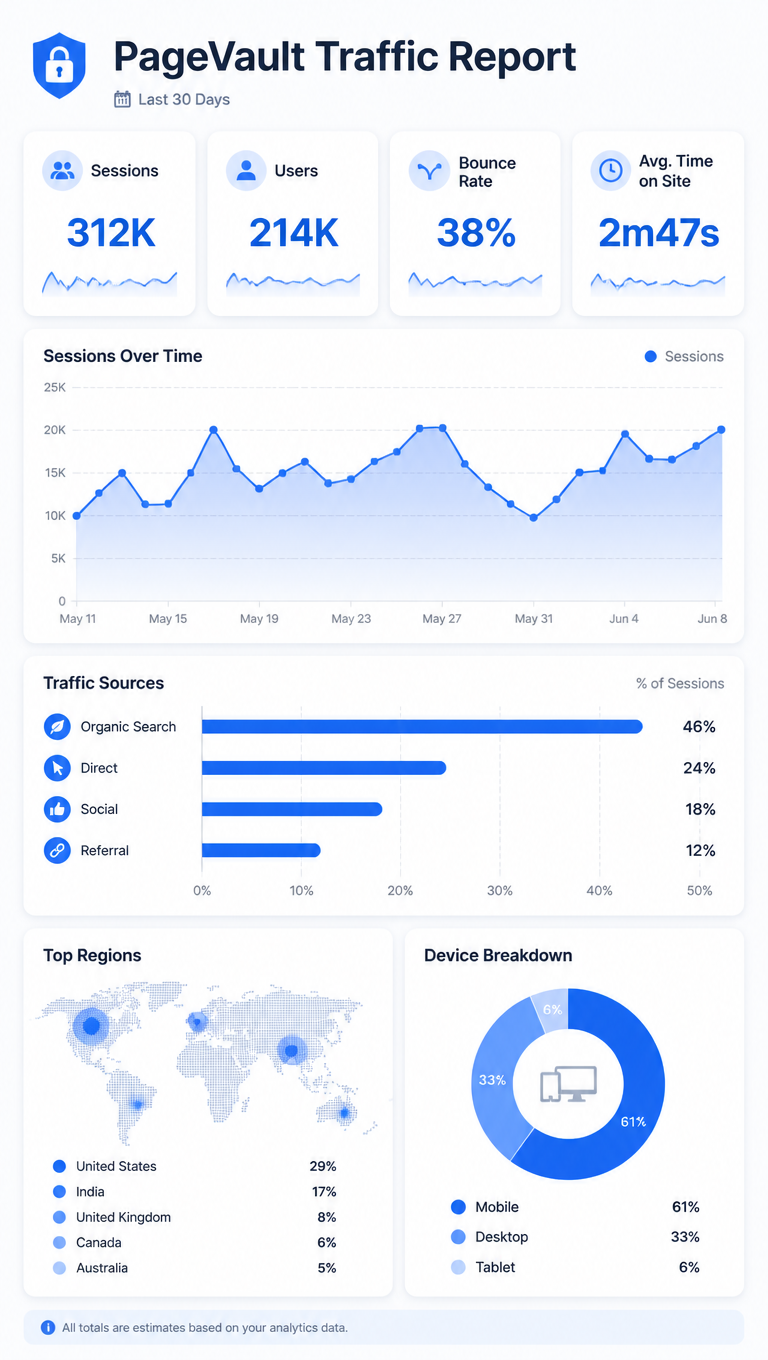
A dashboard infographic, 9:16, titled 'PageVault Traffic Report'. A vertical analytics slide: top tiles show Sessions 312K, Users 214K, Bounce 38%, Avg Time 2m47s. An area chart plots daily sessions over 30 days, a horizontal bar ranks traffic sources (Organic 46%, Direct 24%, Social 18%, Referral 12%), and a small world-map dot cluster highlights top regions. A device-split mini donut (Mobile 61%, Desktop 33%, Tablet 6%). Cool blue-and-white palette, rounded card widgets, faint grid, clean modern web-analytics dashboard aesthetic.How to use
- Copy the complete original prompt, including any parameters.
- Replace the subject, text and composition with your own requirements.
- Use a compatible external tool; check its current access conditions and review the result.
Before you start
- Check whether a reference image is required. A compatible model label does not mean this example was generated with that model.
- Keep names, figures and visible text accurate; results can vary between model versions.