Design illustration · Fitness App Weekly Report — API Models · CC BY 4.0

Design illustration · Fitness App Weekly Report — API Models · CC BY 4.0

原始文档

GPT Image 2 · en

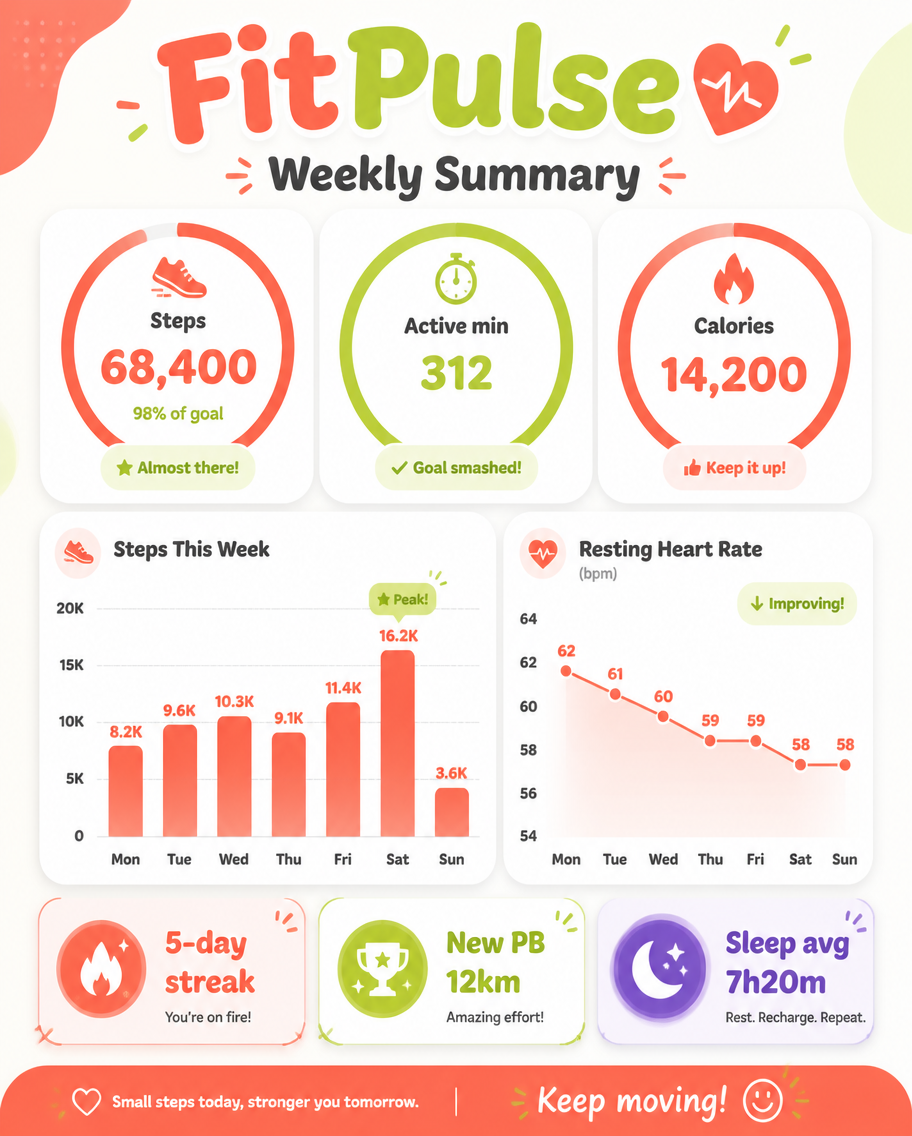
A dashboard infographic, 4:5, titled 'FitPulse Weekly Summary'. A friendly report slide: a top ring-chart trio shows Steps 68,400 (98% of goal), Active min 312, Calories 14,200. A weekly bar chart plots steps Mon-Sun peaking Saturday, a small line shows resting heart rate trending down 62-58 bpm, and three badge chips: '5-day streak', 'New PB 12km', 'Sleep avg 7h20m'. Energetic coral, lime, and white palette, rounded progress rings, soft shadows, motivating clean fitness-app dashboard aesthetic, bubbly headings.

使用方法

  1. 复制完整原始提示词,并保留其中的参数。
  2. 按需求替换主体、文字和构图要求。
  3. 在兼容的外部工具中使用,核对当前使用条件并检查结果。

开始前需了解

  • 先确认是否需要参考图。标注兼容模型,不代表该示例由这个模型生成。
  • 核对名称、数字与画面文字;不同模型版本的结果可能不同。

相似案例

Fitness SaaS Landing Page UI
GPT Image 2en

Design a modern, high-end{argument name="app type" default="Fitness app"} Landing page and product UI, brand name is{argument name="brand name" default="PulseFit"} Create a clean web design mockup that resembles a legitimate SaaS fitness platform and its accompanying mobile app.

Leaked AI Benchmark Report Photo
GPT Image 2en

{ "type": "Photograph of a computer monitor displaying academic and technical reports.", "style": "Slightly tilted screen photo, showing moiré patterns, LCD pixel grid, slight reflections, LaTeX document layout, serif font.", "document_header": { "left": "4. Benchmark A