Original document
GPT Image 2 · en
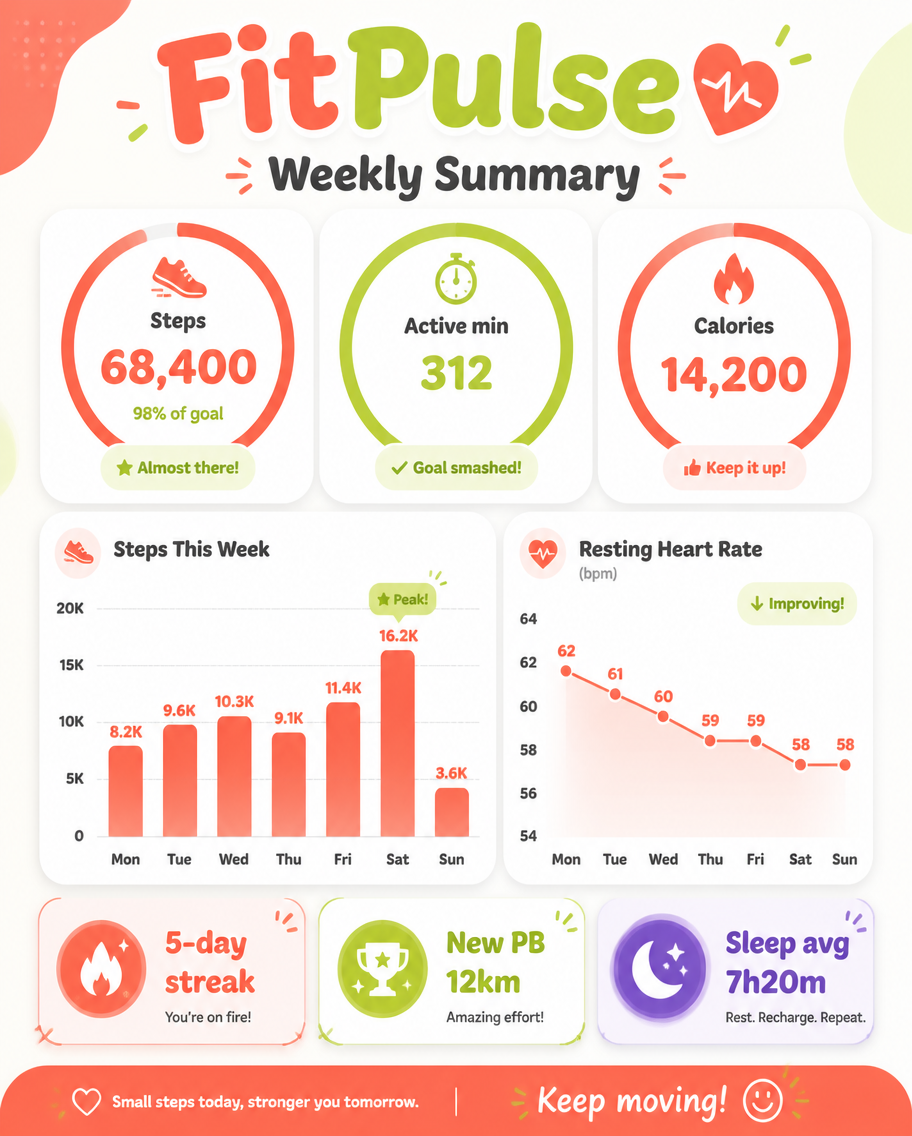
A dashboard infographic, 4:5, titled 'FitPulse Weekly Summary'. A friendly report slide: a top ring-chart trio shows Steps 68,400 (98% of goal), Active min 312, Calories 14,200. A weekly bar chart plots steps Mon-Sun peaking Saturday, a small line shows resting heart rate trending down 62-58 bpm, and three badge chips: '5-day streak', 'New PB 12km', 'Sleep avg 7h20m'. Energetic coral, lime, and white palette, rounded progress rings, soft shadows, motivating clean fitness-app dashboard aesthetic, bubbly headings.How to use
- Copy the complete original prompt, including any parameters.
- Replace the subject, text and composition with your own requirements.
- Use a compatible external tool; check its current access conditions and review the result.
Before you start
- Check whether a reference image is required. A compatible model label does not mean this example was generated with that model.
- Keep names, figures and visible text accurate; results can vary between model versions.