Document original
GPT Image 2 · en
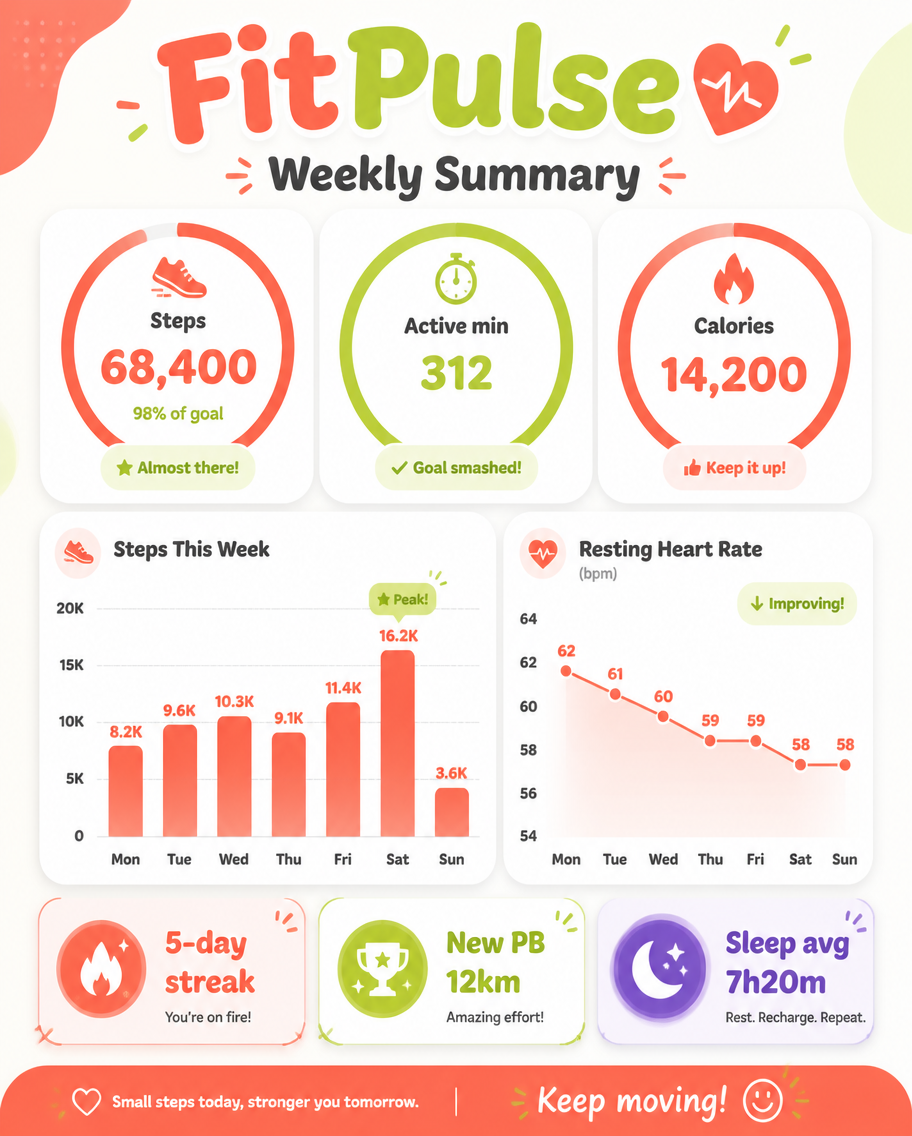
A dashboard infographic, 4:5, titled 'FitPulse Weekly Summary'. A friendly report slide: a top ring-chart trio shows Steps 68,400 (98% of goal), Active min 312, Calories 14,200. A weekly bar chart plots steps Mon-Sun peaking Saturday, a small line shows resting heart rate trending down 62-58 bpm, and three badge chips: '5-day streak', 'New PB 12km', 'Sleep avg 7h20m'. Energetic coral, lime, and white palette, rounded progress rings, soft shadows, motivating clean fitness-app dashboard aesthetic, bubbly headings.Mode d’emploi
- Copiez le prompt original complet, paramètres compris.
- Adaptez le sujet, le texte et la composition à vos besoins.
- Utilisez un outil externe compatible ; vérifiez l’accès et le résultat.
Avant de commencer
- Vérifiez si une image de référence est nécessaire. La compatibilité ne prouve pas le modèle utilisé pour cet exemple.
- Vérifiez noms, chiffres et textes ; les versions du modèle peuvent produire des résultats différents.