Oryginalny dokument
GPT Image 2 · en
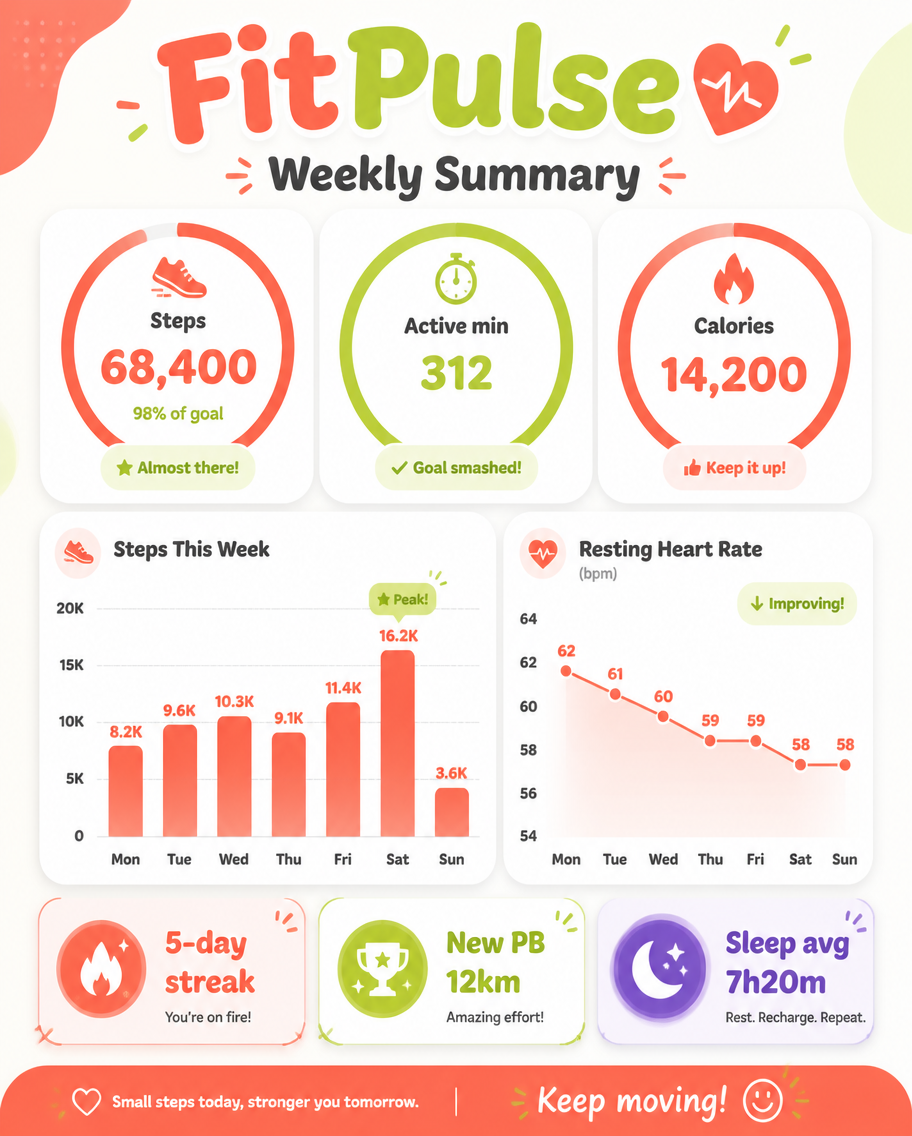
A dashboard infographic, 4:5, titled 'FitPulse Weekly Summary'. A friendly report slide: a top ring-chart trio shows Steps 68,400 (98% of goal), Active min 312, Calories 14,200. A weekly bar chart plots steps Mon-Sun peaking Saturday, a small line shows resting heart rate trending down 62-58 bpm, and three badge chips: '5-day streak', 'New PB 12km', 'Sleep avg 7h20m'. Energetic coral, lime, and white palette, rounded progress rings, soft shadows, motivating clean fitness-app dashboard aesthetic, bubbly headings.Jak używać
- Skopiuj cały oryginalny prompt wraz z parametrami.
- Dostosuj temat, tekst i kompozycję do swoich potrzeb.
- Użyj zgodnego narzędzia zewnętrznego; sprawdź warunki dostępu i wynik.
Przed rozpoczęciem
- Sprawdź, czy potrzebny jest obraz referencyjny. Zgodność nie potwierdza modelu użytego do przykładu.
- Sprawdź nazwy, liczby i napisy; wyniki zależą od wersji modelu.