Originaldokument
GPT Image 2 · en
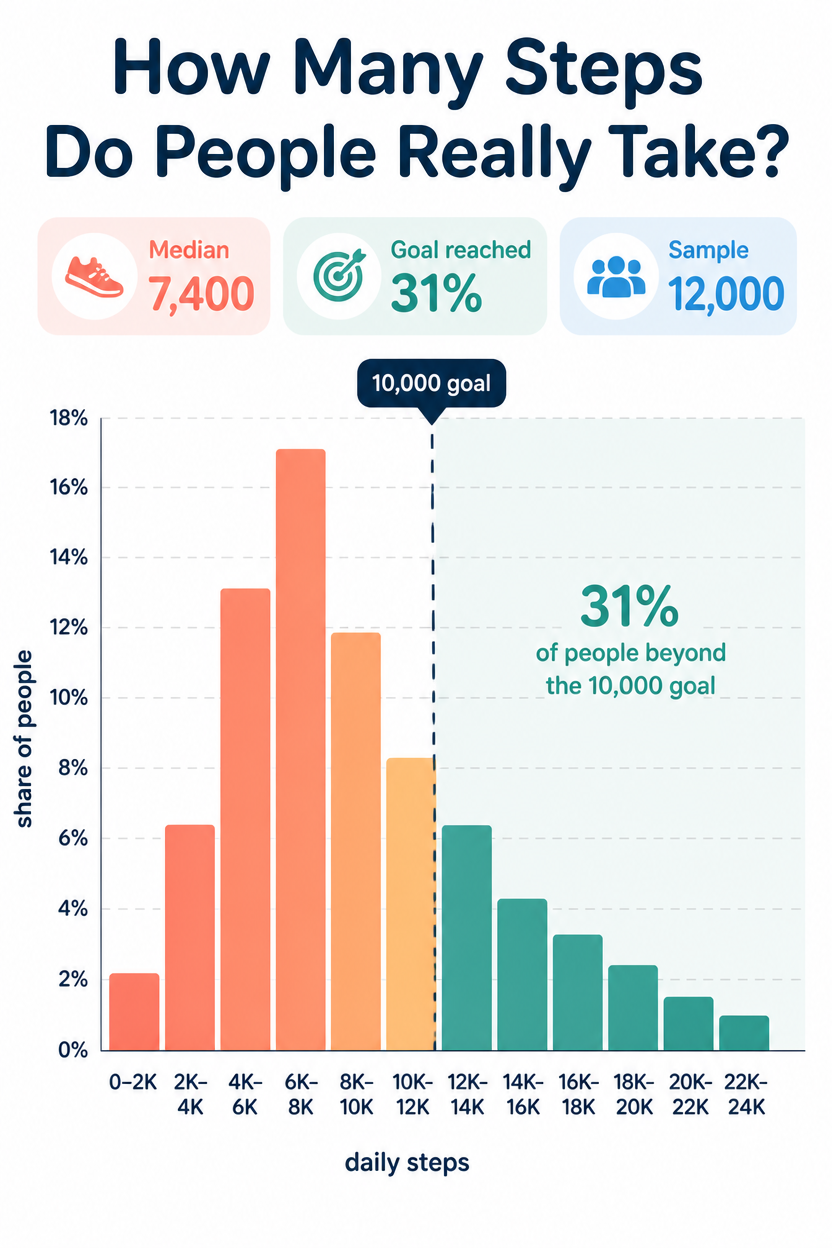
A health infographic, 2:3, titled 'How Many Steps Do People Really Take?'. A histogram of daily step counts across 12 buckets from 0 to 24,000, bars in a coral-to-teal gradient, the tallest bar peaking around the 6,000-8,000 range. A dashed vertical line marks the '10,000 goal' with 31% of people beyond it shaded darker. X-axis step buckets, Y-axis 'share of people', light grid. Three highlight chips: 'Median 7,400', 'Goal reached 31%', 'Sample 12,000'. White background, flat, friendly rounded type.Verwendung
- Den vollständigen Original-Prompt einschließlich Parametern kopieren.
- Motiv, Text und Komposition an die eigenen Anforderungen anpassen.
- Ein kompatibles externes Werkzeug nutzen; Zugangsbedingungen und Ergebnis prüfen.
Vor dem Start
- Prüfen, ob ein Referenzbild nötig ist. Kompatibilität belegt nicht das tatsächlich verwendete Modell.
- Namen, Zahlen und Bildtexte prüfen; Modellversionen können andere Ergebnisse liefern.