Document original
GPT Image 2 · en
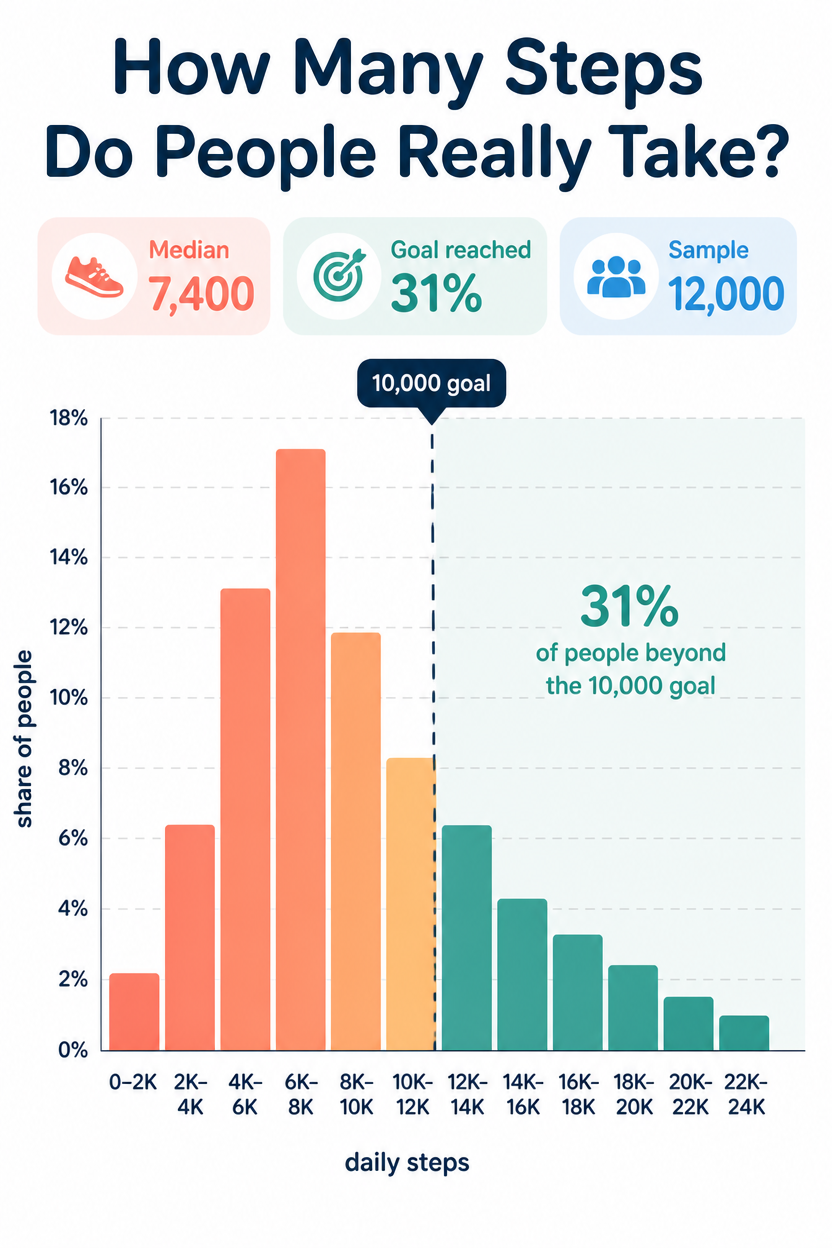
A health infographic, 2:3, titled 'How Many Steps Do People Really Take?'. A histogram of daily step counts across 12 buckets from 0 to 24,000, bars in a coral-to-teal gradient, the tallest bar peaking around the 6,000-8,000 range. A dashed vertical line marks the '10,000 goal' with 31% of people beyond it shaded darker. X-axis step buckets, Y-axis 'share of people', light grid. Three highlight chips: 'Median 7,400', 'Goal reached 31%', 'Sample 12,000'. White background, flat, friendly rounded type.Mode d’emploi
- Copiez le prompt original complet, paramètres compris.
- Adaptez le sujet, le texte et la composition à vos besoins.
- Utilisez un outil externe compatible ; vérifiez l’accès et le résultat.
Avant de commencer
- Vérifiez si une image de référence est nécessaire. La compatibilité ne prouve pas le modèle utilisé pour cet exemple.
- Vérifiez noms, chiffres et textes ; les versions du modèle peuvent produire des résultats différents.