原始文档
GPT Image 2 · en
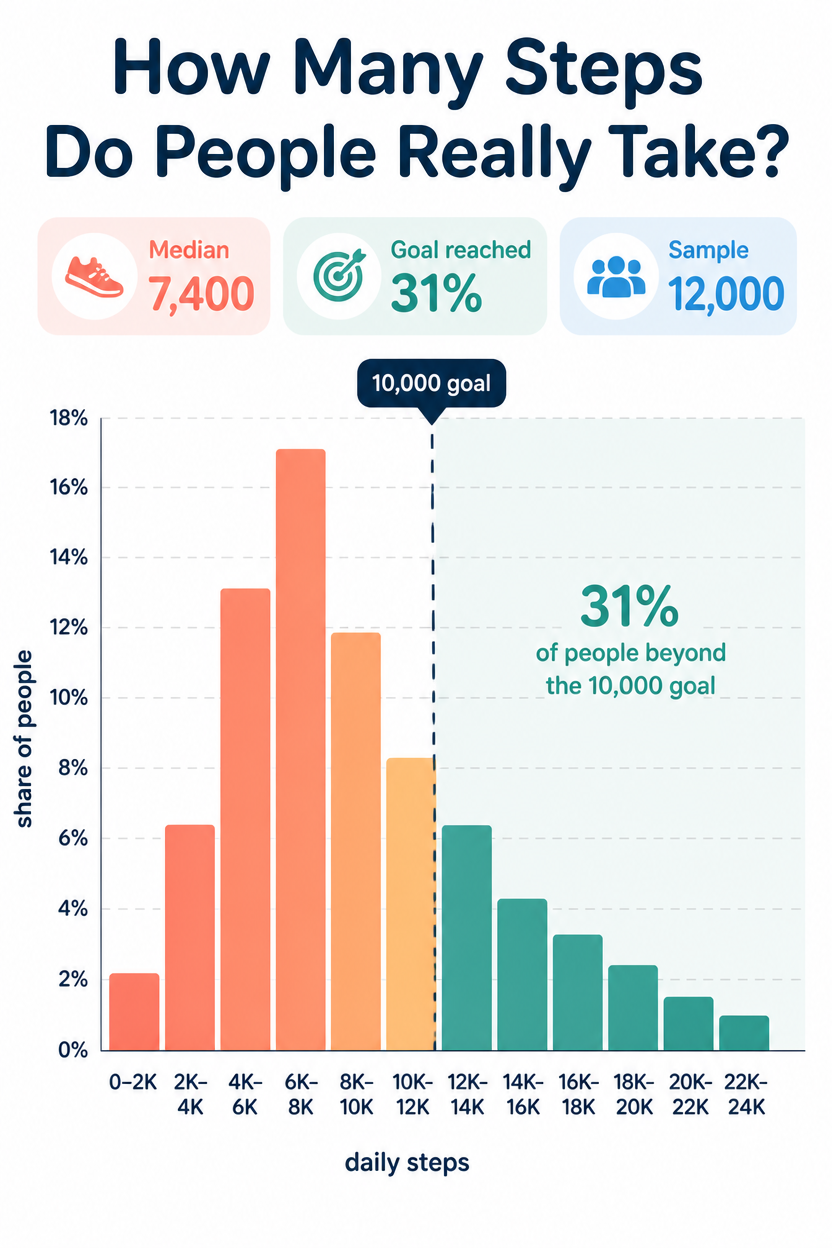
A health infographic, 2:3, titled 'How Many Steps Do People Really Take?'. A histogram of daily step counts across 12 buckets from 0 to 24,000, bars in a coral-to-teal gradient, the tallest bar peaking around the 6,000-8,000 range. A dashed vertical line marks the '10,000 goal' with 31% of people beyond it shaded darker. X-axis step buckets, Y-axis 'share of people', light grid. Three highlight chips: 'Median 7,400', 'Goal reached 31%', 'Sample 12,000'. White background, flat, friendly rounded type.使用方法
- 复制完整原始提示词,并保留其中的参数。
- 按需求替换主体、文字和构图要求。
- 在兼容的外部工具中使用,核对当前使用条件并检查结果。
开始前需了解
- 先确认是否需要参考图。标注兼容模型,不代表该示例由这个模型生成。
- 核对名称、数字与画面文字;不同模型版本的结果可能不同。