Documento original
GPT Image 2 · en
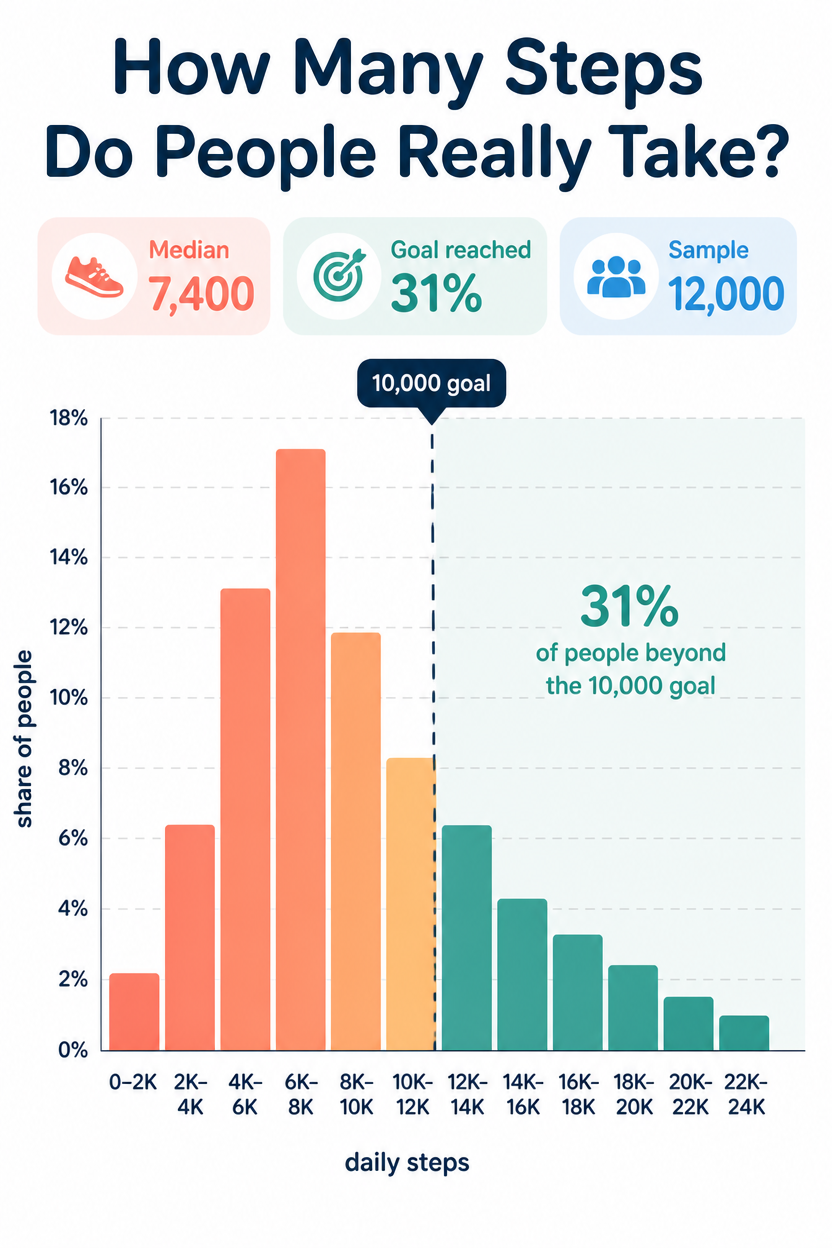
A health infographic, 2:3, titled 'How Many Steps Do People Really Take?'. A histogram of daily step counts across 12 buckets from 0 to 24,000, bars in a coral-to-teal gradient, the tallest bar peaking around the 6,000-8,000 range. A dashed vertical line marks the '10,000 goal' with 31% of people beyond it shaded darker. X-axis step buckets, Y-axis 'share of people', light grid. Three highlight chips: 'Median 7,400', 'Goal reached 31%', 'Sample 12,000'. White background, flat, friendly rounded type.Como usar
- Copie o prompt original completo, incluindo os parâmetros.
- Adapte o tema, o texto e a composição aos seus requisitos.
- Use uma ferramenta externa compatível; confira o acesso e o resultado.
Antes de começar
- Verifique se é necessária uma imagem de referência. Compatibilidade não comprova qual modelo gerou o exemplo.
- Confira nomes, números e textos; os resultados variam entre versões do modelo.