Documento originale
GPT Image 2 · en
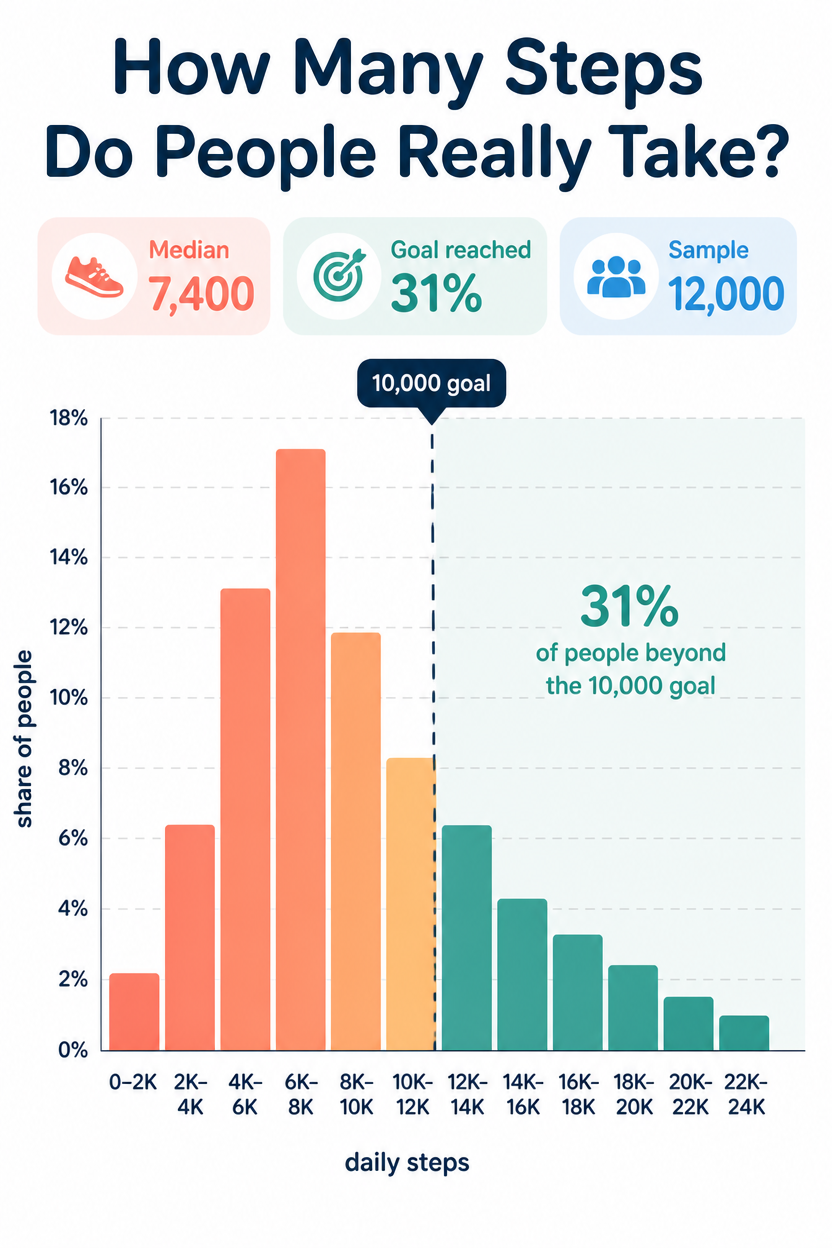
A health infographic, 2:3, titled 'How Many Steps Do People Really Take?'. A histogram of daily step counts across 12 buckets from 0 to 24,000, bars in a coral-to-teal gradient, the tallest bar peaking around the 6,000-8,000 range. A dashed vertical line marks the '10,000 goal' with 31% of people beyond it shaded darker. X-axis step buckets, Y-axis 'share of people', light grid. Three highlight chips: 'Median 7,400', 'Goal reached 31%', 'Sample 12,000'. White background, flat, friendly rounded type.Come usare
- Copia tutto il prompt originale, inclusi i parametri.
- Adatta soggetto, testo e composizione alle tue esigenze.
- Usa uno strumento esterno compatibile; verifica accesso e risultato.
Prima di iniziare
- Controlla se serve un’immagine di riferimento. La compatibilità non prova il modello usato per l’esempio.
- Verifica nomi, numeri e testi; i risultati cambiano con le versioni del modello.