原文
GPT Image 2 · en
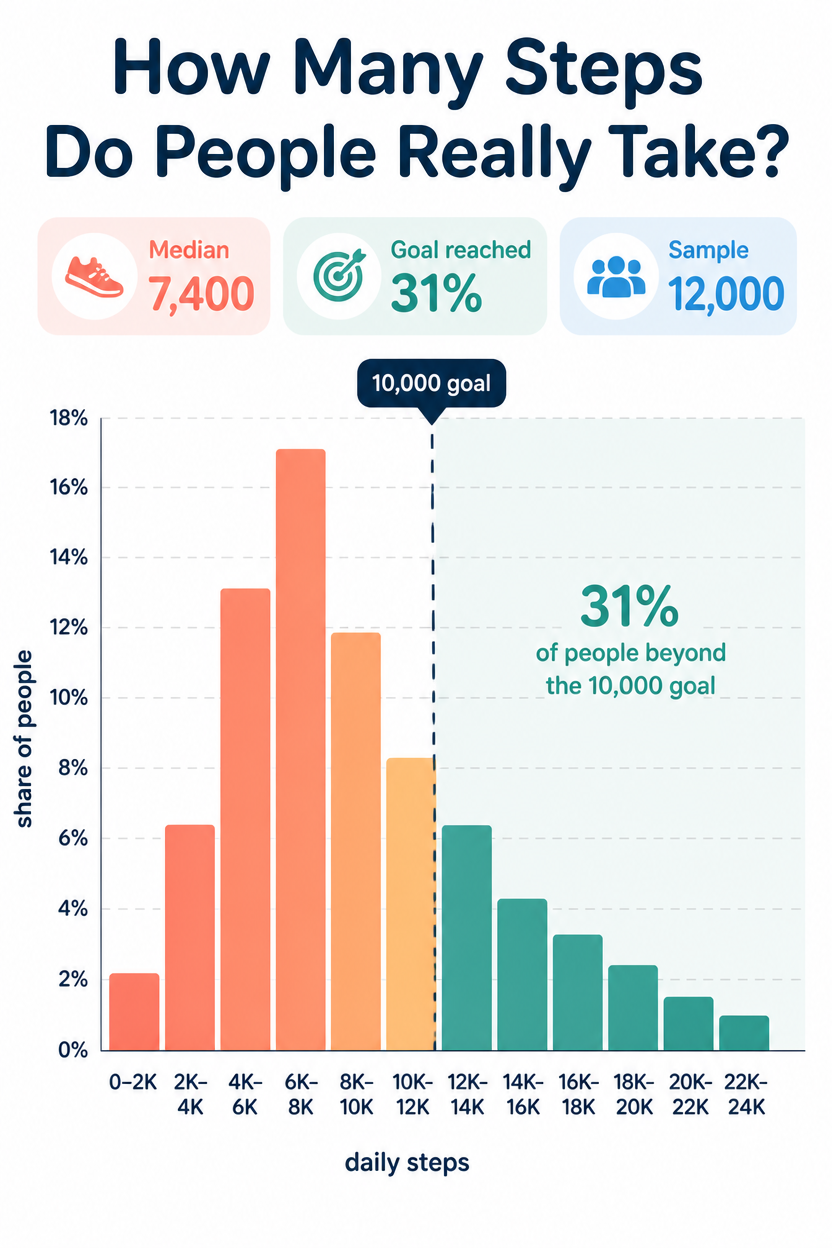
A health infographic, 2:3, titled 'How Many Steps Do People Really Take?'. A histogram of daily step counts across 12 buckets from 0 to 24,000, bars in a coral-to-teal gradient, the tallest bar peaking around the 6,000-8,000 range. A dashed vertical line marks the '10,000 goal' with 31% of people beyond it shaded darker. X-axis step buckets, Y-axis 'share of people', light grid. Three highlight chips: 'Median 7,400', 'Goal reached 31%', 'Sample 12,000'. White background, flat, friendly rounded type.使い方
- パラメータを含む元のプロンプト全体をコピーします。
- 被写体、文字、構図を自分の要件に置き換えます。
- 対応する外部ツールで使用し、利用条件と結果を確認します。
開始前の確認
- 参考画像の要否を確認してください。互換モデルの表示は、そのモデルでの生成実績を意味しません。
- 名前、数値、画像内の文字を確認します。モデルの版で結果は変わります。