Design illustration · Daily Steps Histogram — API Models · CC BY 4.0

Design illustration · Daily Steps Histogram — API Models · CC BY 4.0

원본 문서

GPT Image 2 · en

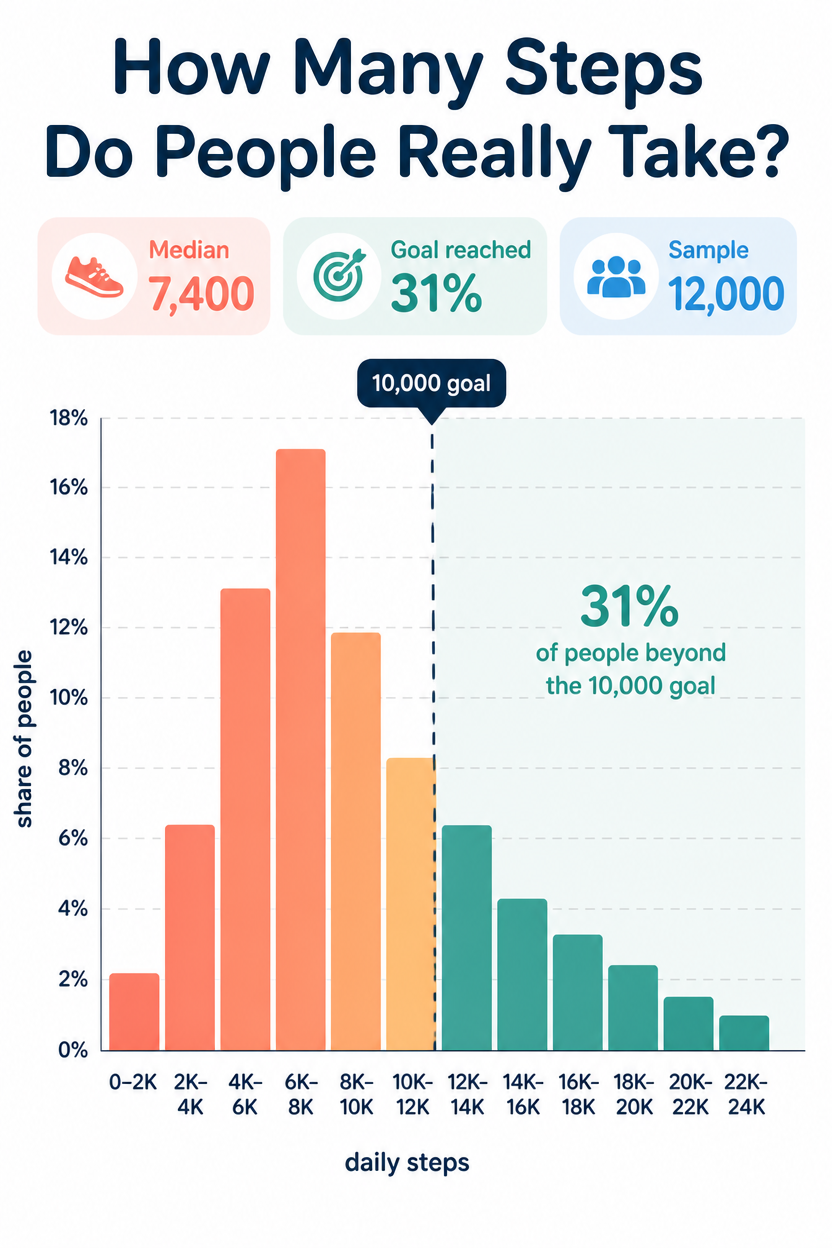
A health infographic, 2:3, titled 'How Many Steps Do People Really Take?'. A histogram of daily step counts across 12 buckets from 0 to 24,000, bars in a coral-to-teal gradient, the tallest bar peaking around the 6,000-8,000 range. A dashed vertical line marks the '10,000 goal' with 31% of people beyond it shaded darker. X-axis step buckets, Y-axis 'share of people', light grid. Three highlight chips: 'Median 7,400', 'Goal reached 31%', 'Sample 12,000'. White background, flat, friendly rounded type.

사용 방법

  1. 매개변수를 포함한 전체 원본 프롬프트를 복사하세요.
  2. 주제, 문구, 구도를 자신의 요구에 맞게 바꾸세요.
  3. 호환되는 외부 도구에서 사용하고 이용 조건과 결과를 확인하세요.

시작 전 확인

  • 참조 이미지가 필요한지 확인하세요. 호환 표시는 해당 모델로 이 예시를 생성했다는 뜻이 아닙니다.
  • 이름, 수치, 이미지 속 문구를 확인하세요. 모델 버전에 따라 결과가 다를 수 있습니다.

비슷한 예시

Toddler Daily Routine Flashcard Grid
GPT Image 2en

{ "type": "{argument name=\"theme\" default=\"Daily Routine Flashcards\"}", "style": "{argument name=\"style\" default=\"Adorable children's book illustration style, soft macaron colors.\"}", "character": "{argument name=\"character\" default=\"A toddler girl with two s

Japanese Cafe Daily Routine Storyboard
GPT Image 2en

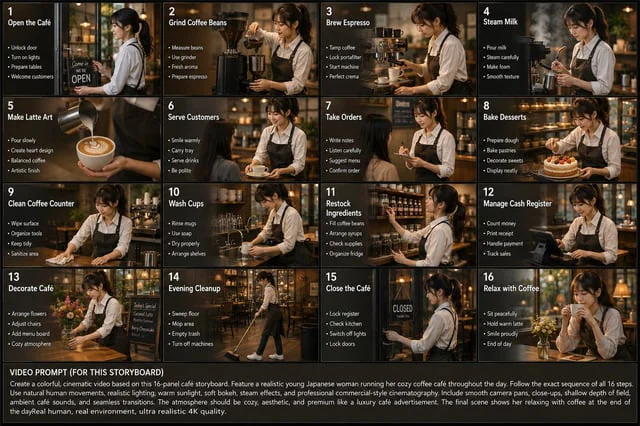
Create a wide 16-panel cinematic storyboard infographic showing the daily routine of a {argument name="subject" default="young Japanese woman"} running her own {argument name="business" default="cozy coffee café"}. Use a realistic photography style with warm cinematic colors, sof