

Nano Banana 2.1 makes two different promises to image-production teams: better results in Google's comparisons and lower charges for generated image tokens. Neither promise, by itself, establishes a cheaper publishable asset. The useful question is where its measured advantages survive the requirements of a real job—identity, factual correctness, protected product details and the full cost of retries.
This October 14 analysis follows Google's October 6 general-availability release, not a new launch. Its strongest signals are infographic preference, multi-character consistency and several editing tasks. Its weakest interpretation would be to turn a preference rating into an accuracy percentage, assume every task benefits equally from Thinking, or call every request half-price.
The deployed endpoint has narrower limits than the model card
The API changelog identifies gemini-nano-banana-2.1 as the stable model. Google describes it as a Flash-class update to Gemini 3.1 Flash Image, or Nano Banana 2, rather than a new Pro model. The model card places it on Gemini 3.6 Flash: text and images go in, images and text come out.
Implementation details matter as much as that family tree. The endpoint documentation specifies 1K output by default, support up to 4K, and minimal, medium and high Thinking, with medium the default. Search grounding is available; function calling, code execution and structured outputs are not. Applications needing those capabilities must supply orchestration and checking outside the image model.
There is also an unresolved capacity discrepancy. The card describes up to one million context tokens and 64K text output, but the Gemini API page lists 131,072 input and 32,768 output tokens. The source documentation does not explain the difference. A deployment should budget against its actual endpoint's documented limits, not silently inherit the larger architectural figures.
Multi-image fusion accepts up to 14 references, including up to four characters and ten objects. These are ceilings on supplied material, not a guarantee that fourteen references—or four separate identities—will be preserved accurately.
The card also names blurred or broken small and lengthy text, identity drift, left/right confusion, imperfect 3D reasoning and factual knowledge, plus occasional slowness and timeouts. Mask residues and persistent poses add separate editing risks. These acknowledged limitations need failure criteria and a fallback; a larger reference or context allowance does not remove them.
Generation gains are preference evidence, not correctness
Google's generation results compare human preferences using Elo. They do not count the percentage of images that are correct. The published ± ranges are useful context, but their confidence definition is absent; sample counts, prompts, resolutions, retry allowances, detailed Thinking settings and equal-compute conditions are also undisclosed.
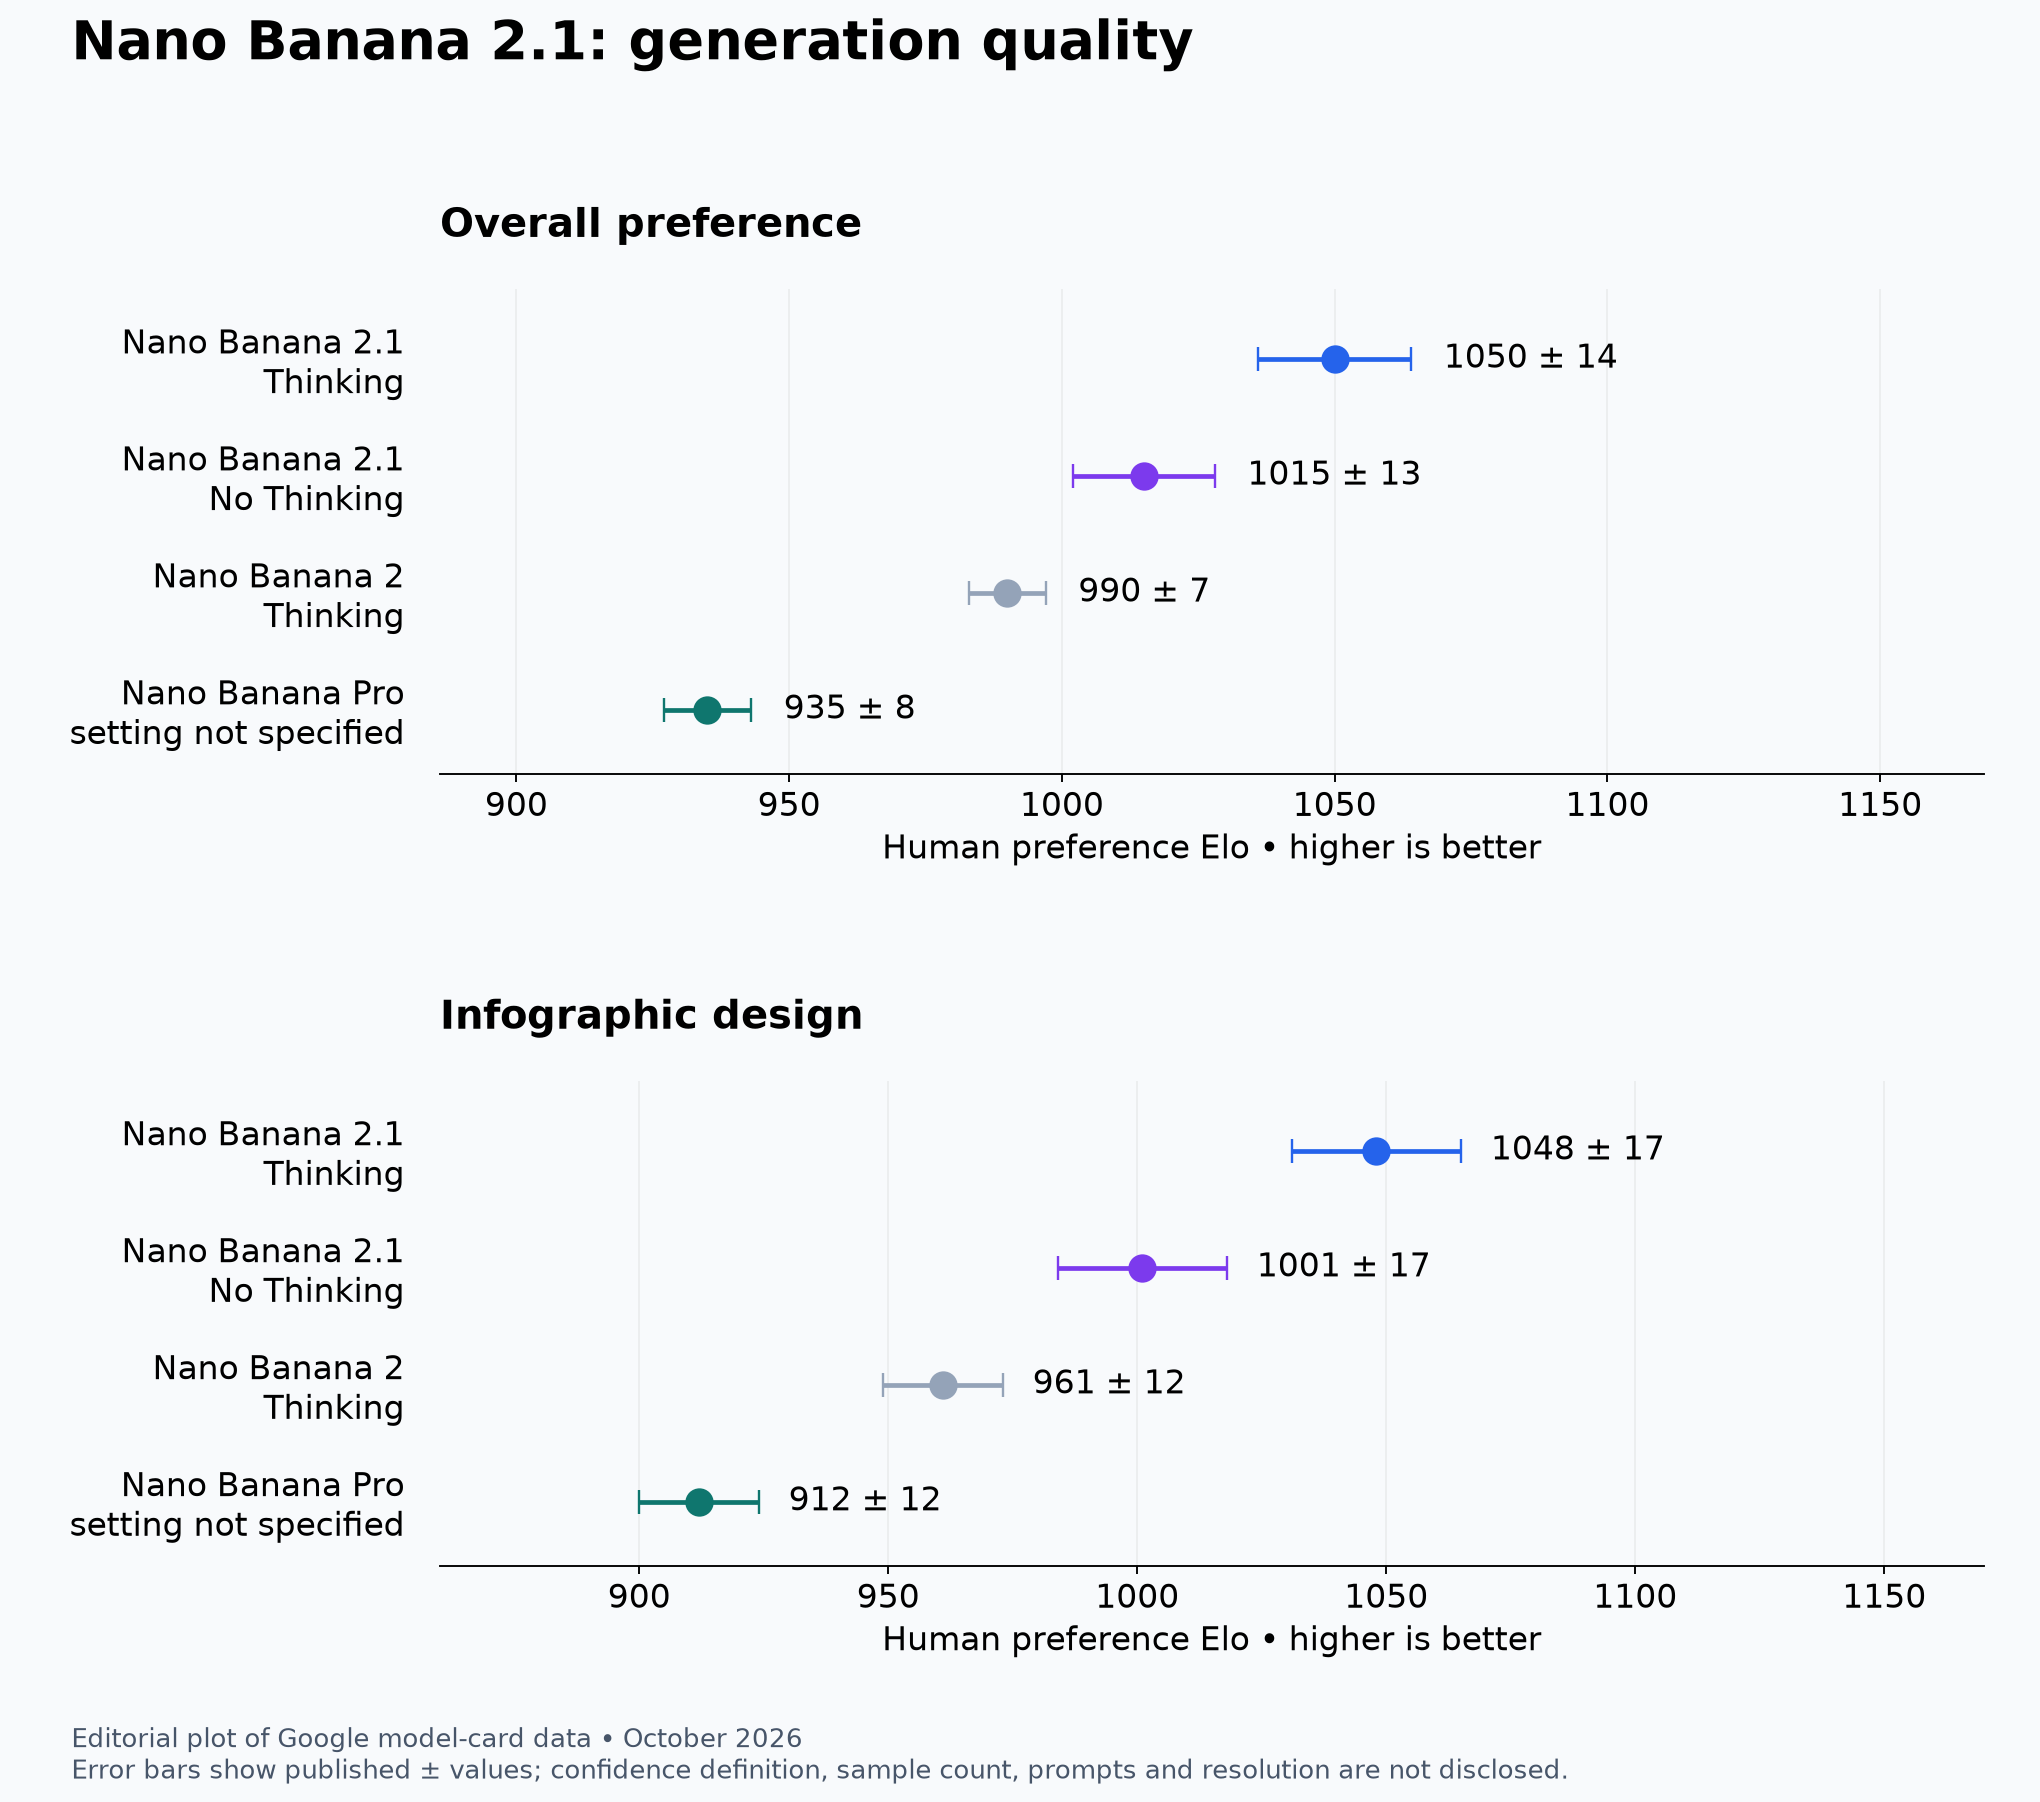
This is an editorial plot of Google's October 2026 model-card data, not an original Google image. Error bars reproduce the published ranges; neither their confidence level nor a production accuracy rate is established.
For overall generation, 2.1 Thinking scores 1050 ±14, 2.1 without Thinking 1015 ±13, Nano Banana 2 Thinking 990 ±7 and Pro 935 ±8. Infographic-design scores, in the same order, are 1048 ±17, 1001 ±17, 961 ±12 and 912 ±12. Both 2.1 modes exceed Nano Banana 2's infographic result even after accounting for their displayed ranges.
Thinking's overall interval, 1036–1064, does not overlap the no-Thinking interval, 1002–1028. That is a more differentiated result than infographic design, where the intervals touch at 1031. Neither comparison establishes the size of a benefit on every prompt. The table's generic “Thinking” label also cannot be equated with the API's high setting: the evaluation configuration is not disclosed.
The distinction prevents an operational shortcut. A preference lead does not establish fewer retries, lower latency or correct chart labels. Google reports no benchmark latency here. Creative teams have a reason to test 2.1, particularly for layout and composition, but not evidence to manufacture a universal speed or return-on-investment claim.
Several characters change the Thinking calculation
A single recurring subject and a scene with several identities are different workloads. Google's consistency results make that difference visible.
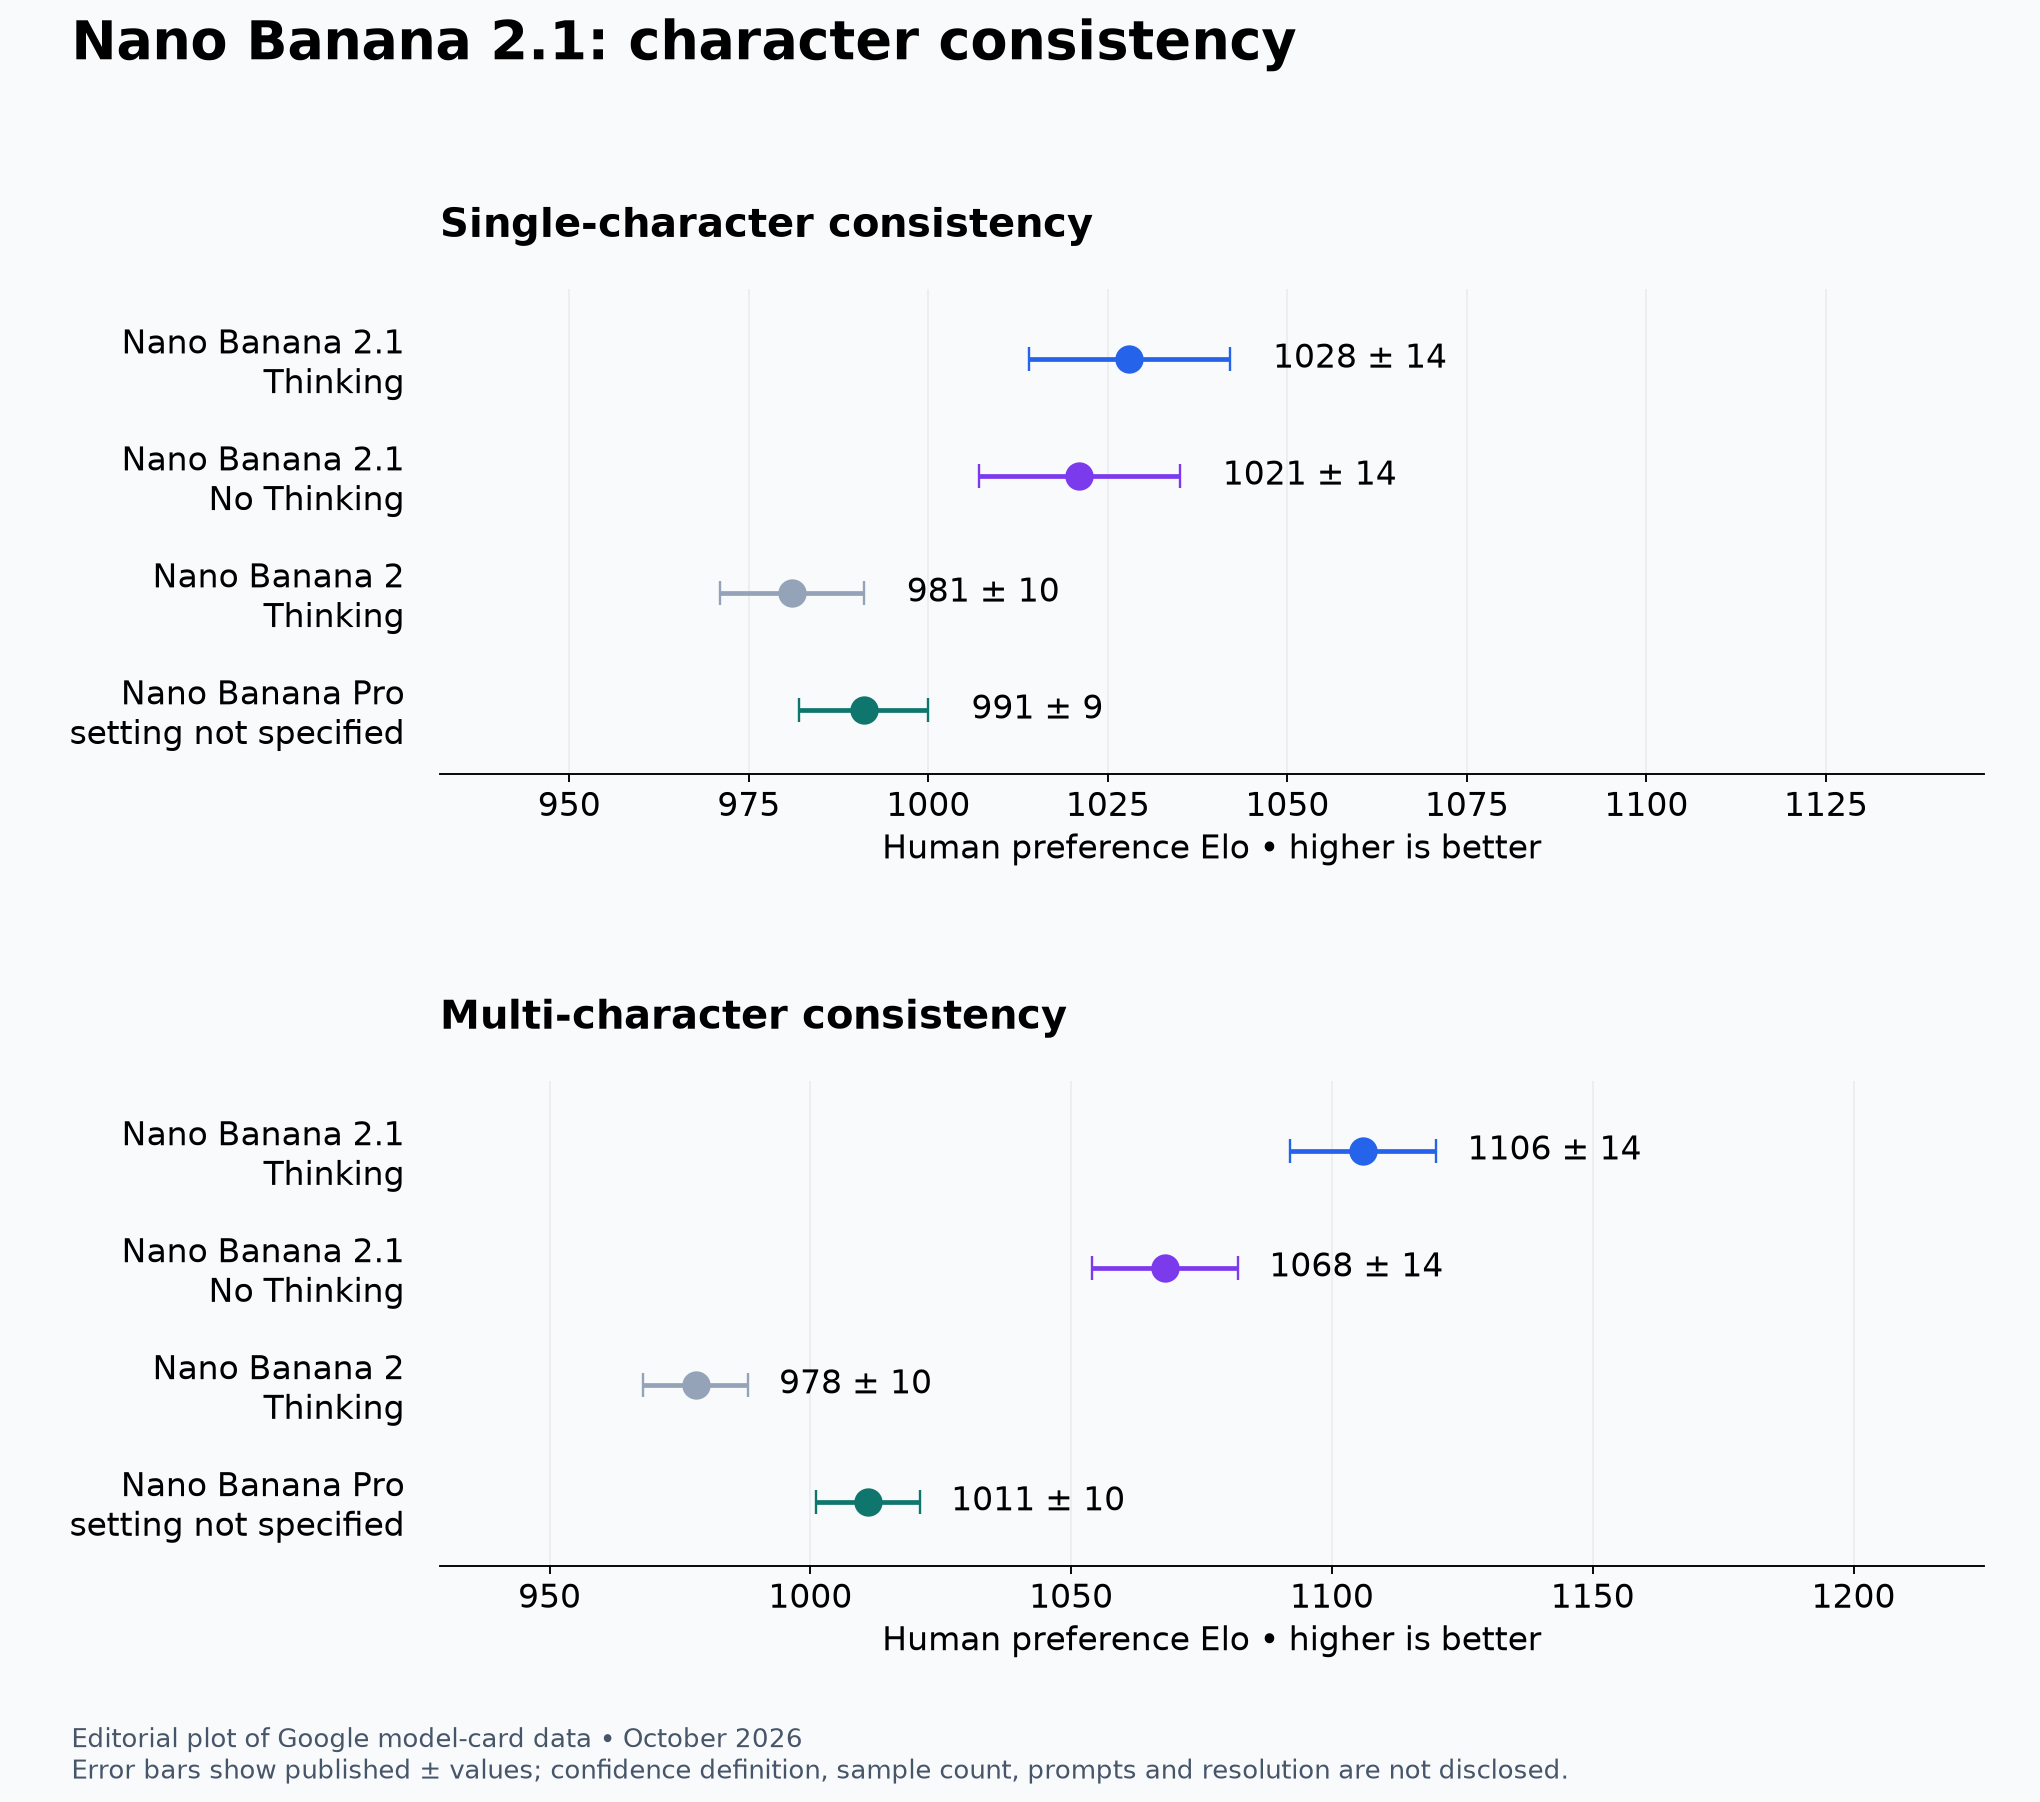
Editorial plot of the same Google model-card dataset. The published ranges are shown without an identified confidence definition; the image is not an original Google illustration.
Single-character scores are 1028 ±14 with 2.1 Thinking and 1021 ±14 without it, compared with 981 ±10 for Nano Banana 2 Thinking and 991 ±9 for Pro. The two 2.1 ranges overlap substantially. Their seven-point difference is not enough to claim that reasoning is necessary on every one-character request.
For multiple characters the separation is larger: 1106 ±14 with Thinking, 1068 ±14 without it, 1011 ±10 for Pro and 978 ±10 for Nano Banana 2 Thinking. The 2.1 ranges do not overlap. This makes Thinking a more promising candidate when several identities and their relationships must be maintained, without proving that four characters will remain reliable under every reference combination.
An attractive group image can still assign one person's clothing to another or omit a subject. The benchmark does not itemize face drift, changed proportions, wardrobe transfer, duplicated characters or relative-height errors. Production review needs per-subject checks, especially with cropped, contradictory, unevenly lit or similar-looking references. A single aesthetic vote can conceal an identity failure that makes the asset unusable.
Editing strength depends on what must not change
The editing results also resist a single “Thinking wins” verdict. Mask editing, product fidelity and combining references protect different parts of an image.
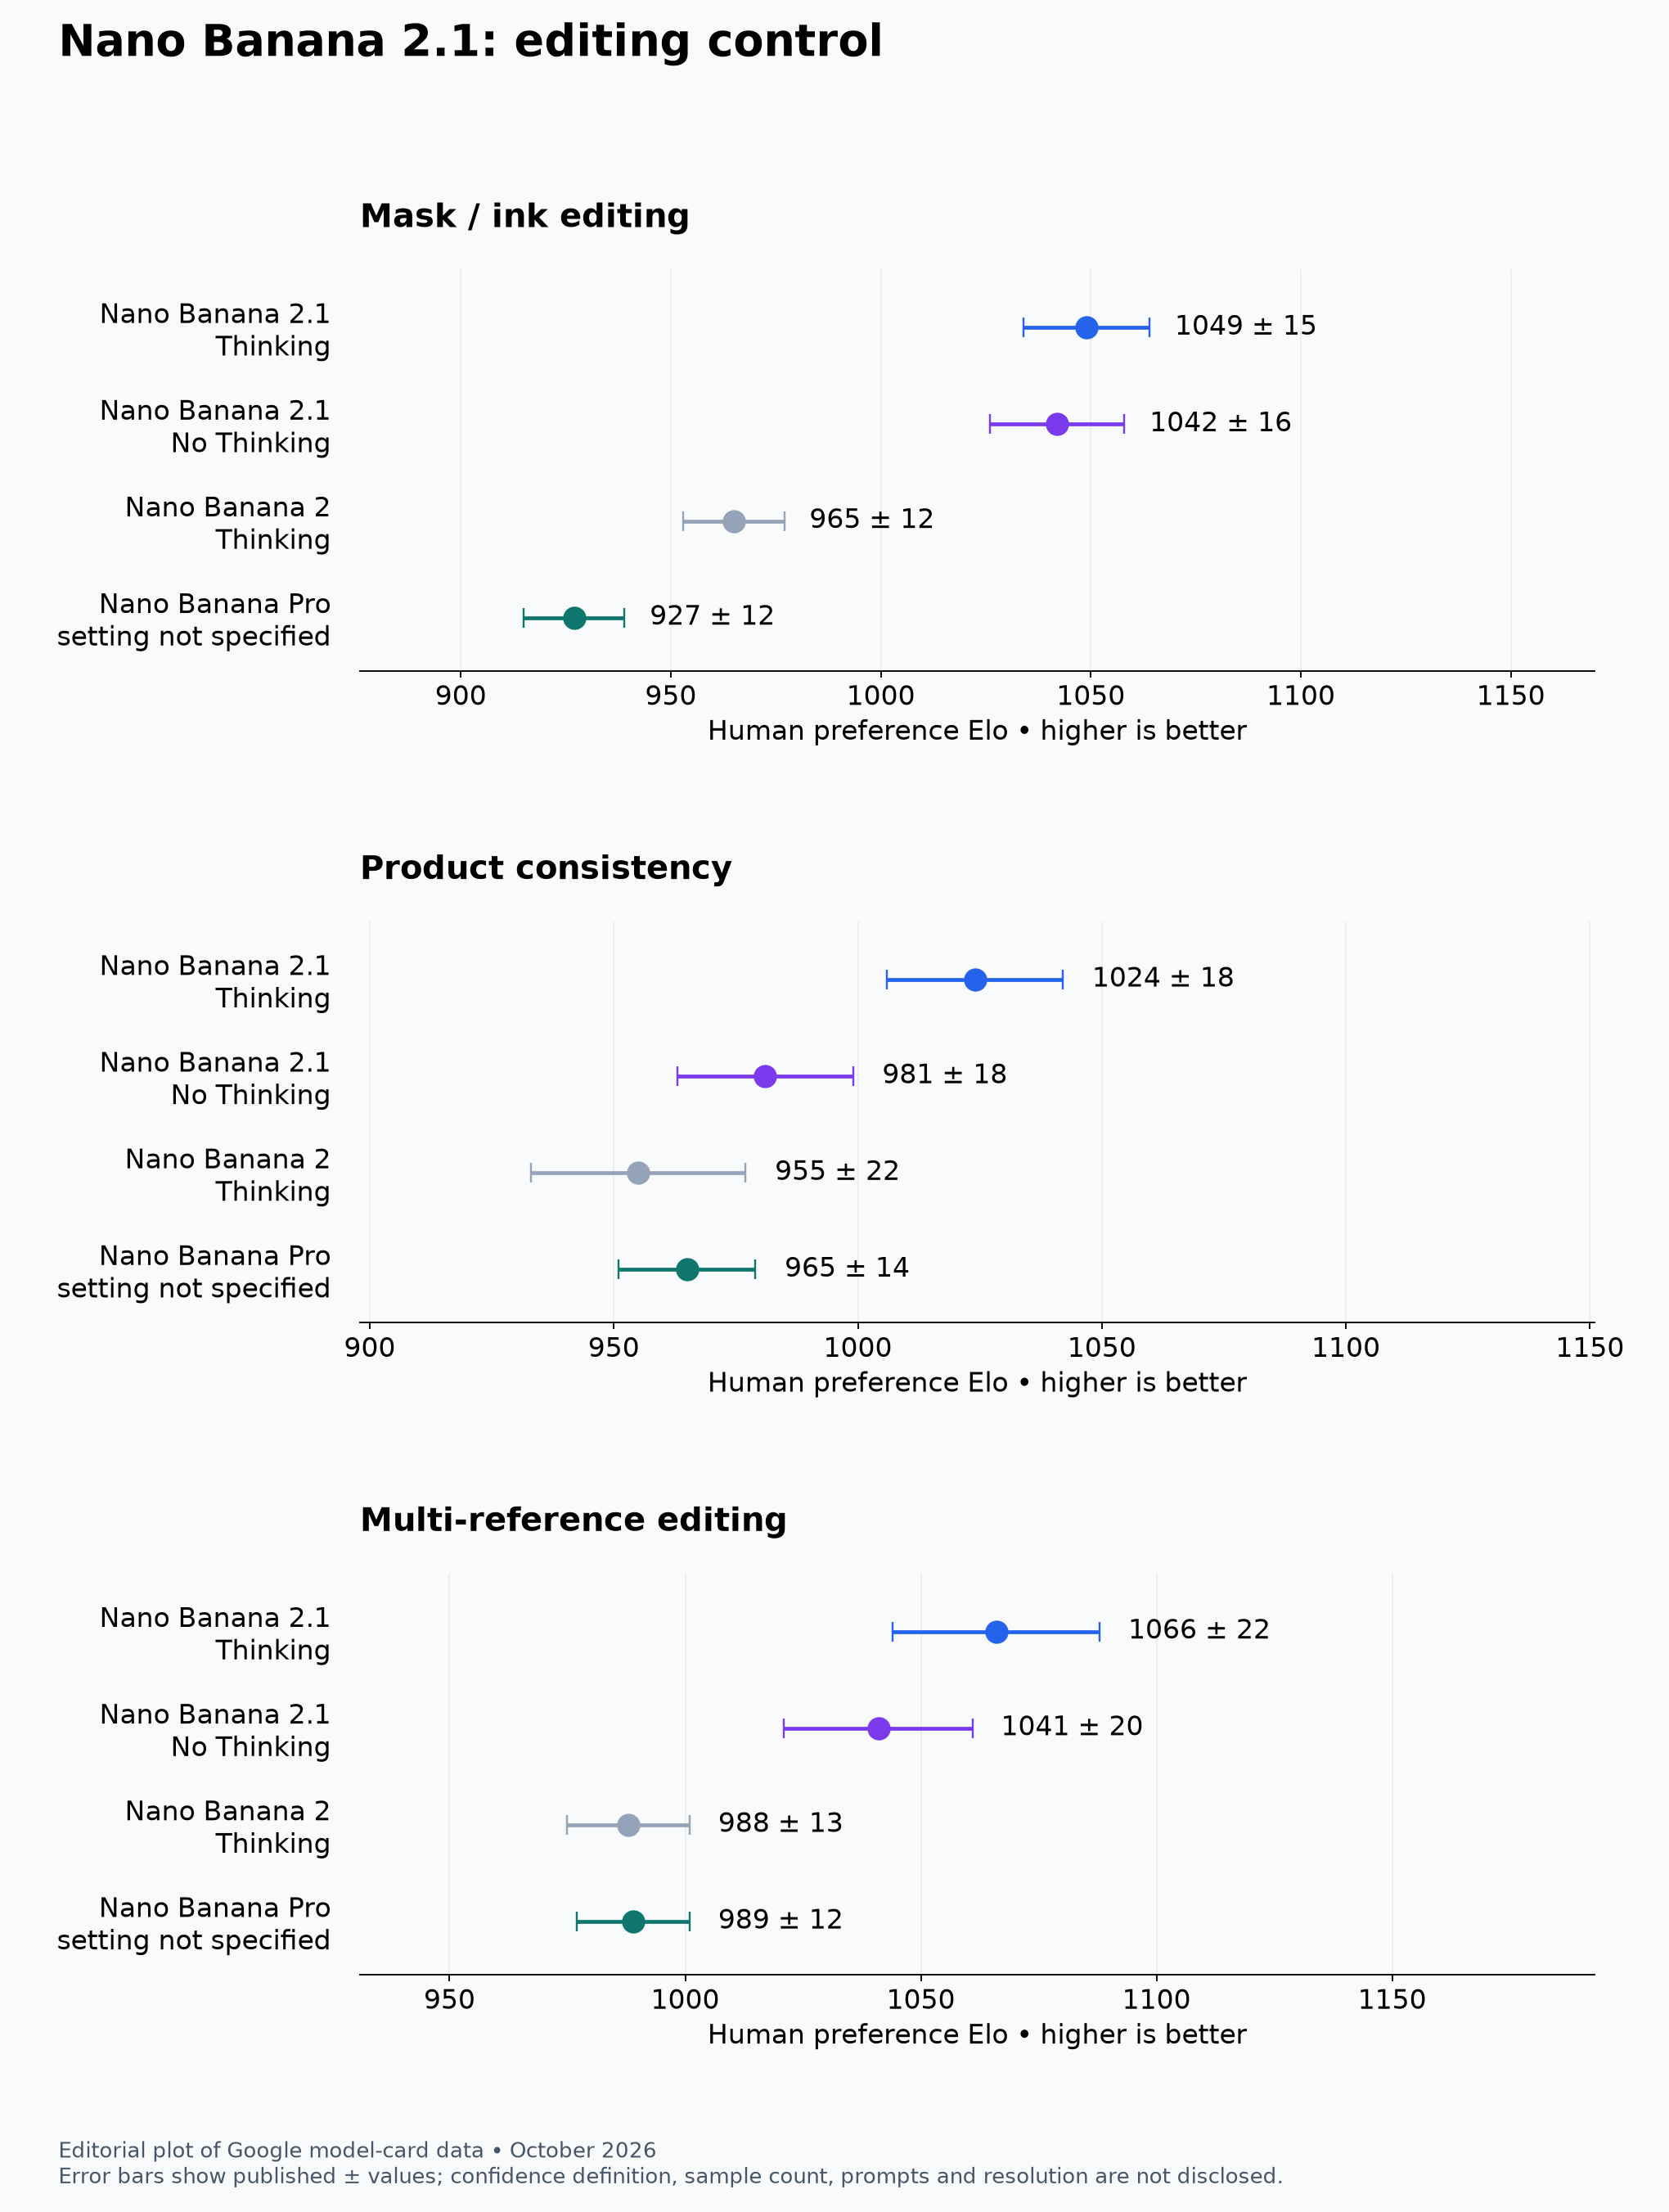
Editorial plot derived from Google's model card, not original Google artwork. Preference Elo and published ± ranges do not measure exact instruction compliance or unchanged pixels outside a mask.
For mask or ink-based edits, 2.1 Thinking scores 1049 ±15 and no Thinking 1042 ±16, with heavily overlapping ranges. Both exceed Nano Banana 2 Thinking at 965 ±12 and Pro at 927 ±12. This supports testing either 2.1 mode rather than treating the seven-point central difference as a demonstrated reasoning benefit.
Product consistency is less forgiving of that interpretation. Thinking reaches 1024 ±18, no Thinking 981 ±18, Nano Banana 2 Thinking 955 ±22 and Pro 965 ±14. The no-Thinking range overlaps both older alternatives. The evidence supports Thinking as the strongest configuration in this comparison, not a decisive improvement from every 2.1 configuration.
For multi-reference editing, 2.1 Thinking scores 1066 ±22 and no Thinking 1041 ±20, against 988 ±13 and 989 ±12 for Nano Banana 2 Thinking and Pro. The 2.1 results are stronger, but their own ranges overlap; the central 25-point difference should not become an unconditional recommendation.
Google acknowledges partial masked-edit compliance, residual ink and unexpected persistence of the original pose. A preferred edit can therefore still fail a preservation requirement. In ecommerce, changing a port, logo, quantity, material or package text may invalidate an otherwise polished image. Creative composites may tolerate geometry changes that product documentation cannot. Those are separate acceptance standards, not details to average into one editing score.
A 0.521 factuality score does not mean 52.1% correct
Infographic factuality is measured differently: a single-sided automated rater, not the generation comparisons' human preferences. Google reports 0.521 for 2.1 Thinking, 0.328 without Thinking, 0.265 for Pro and 0.179 for Nano Banana 2 Thinking.
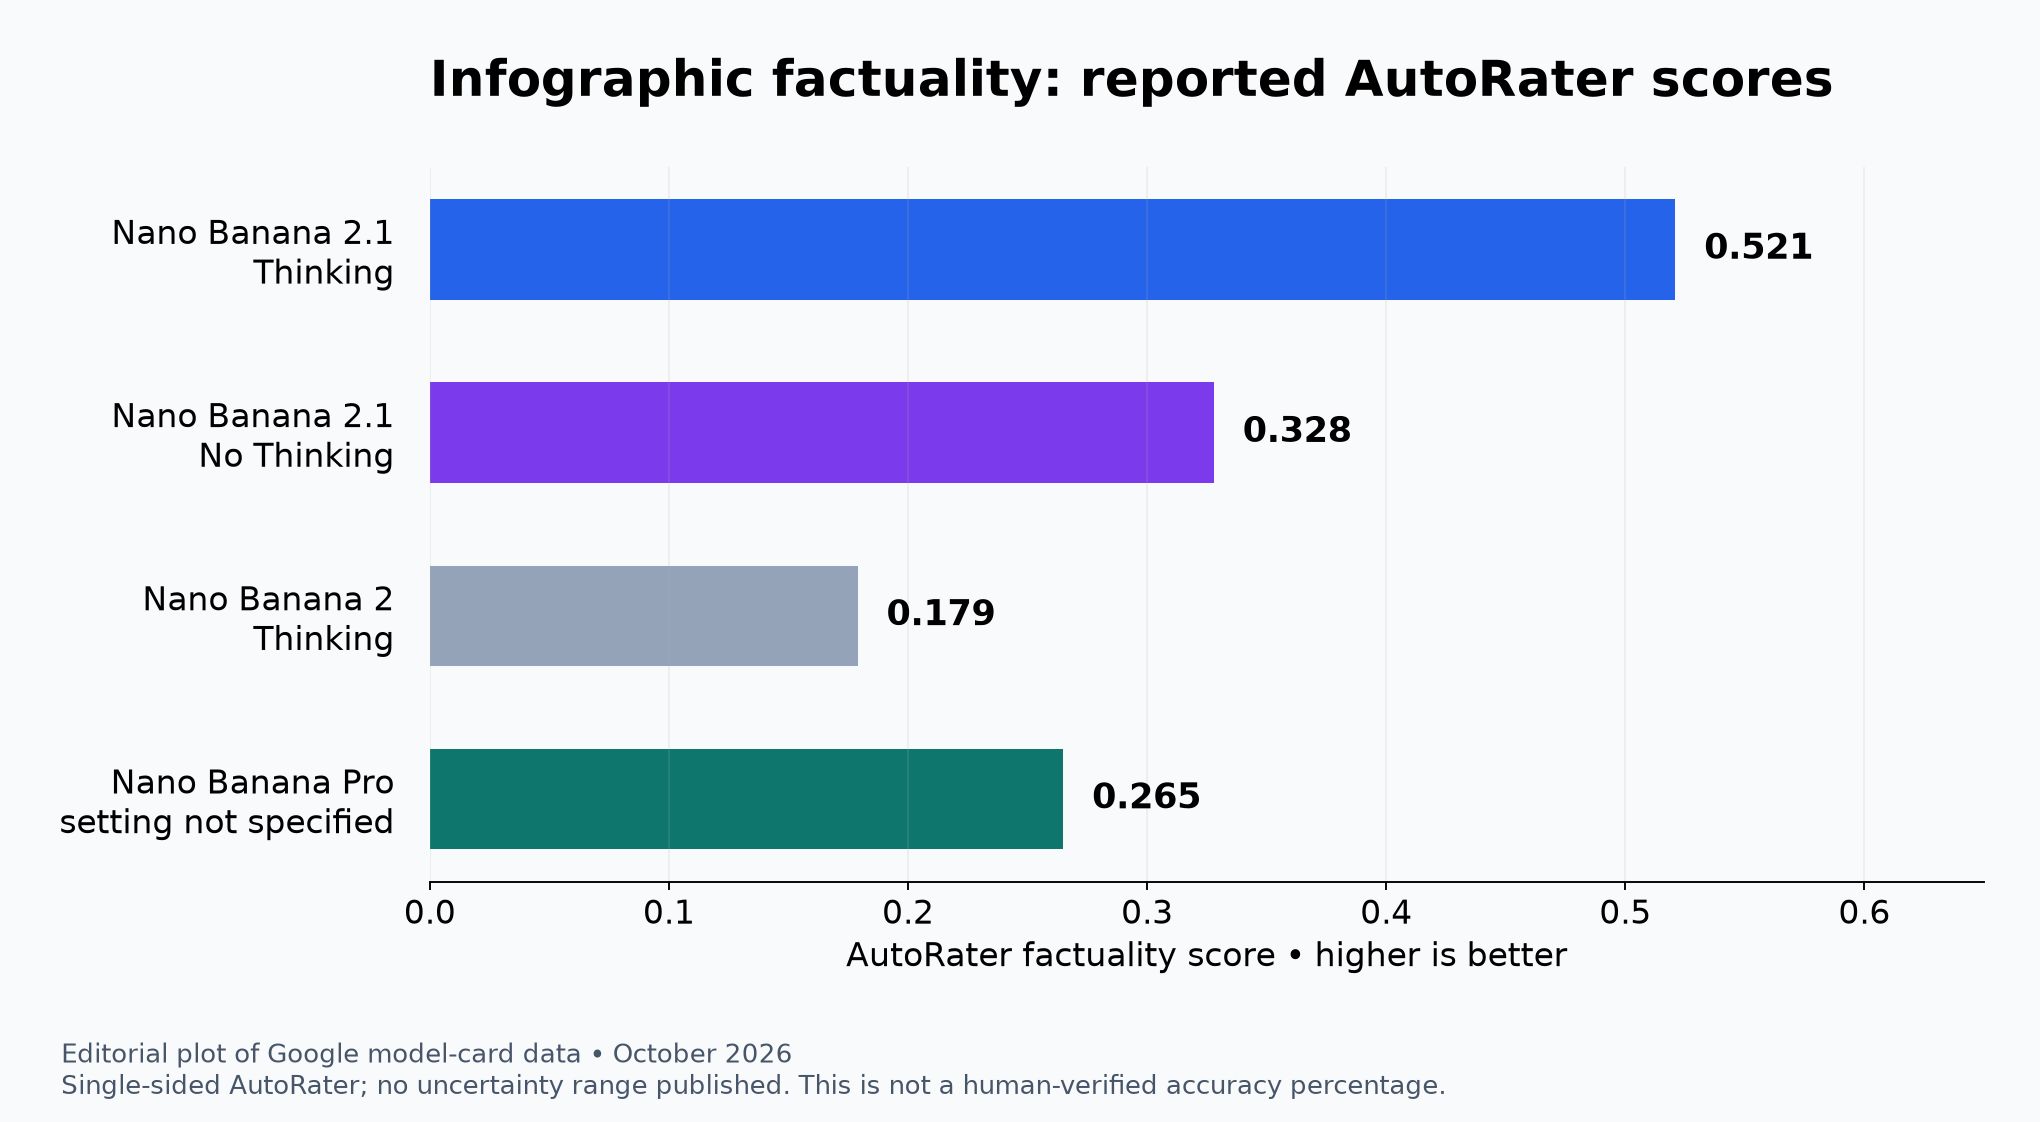
Editorial plot of Google's automated-rater data. No uncertainty range is published for these values; this is neither a Google original image nor a percentage of factually correct infographics.
Thinking leads on the reported measure, but the card does not supply enough methodology, sample information or uncertainty to calculate a production factual-error rate. A chart may contain correct prose yet plot incorrect values; a timeline may reverse events; a map may swap regions or attach a label to the wrong object. The public table does not establish which of these failures its automated rater reliably detects.
Search grounding can retrieve information without guaranteeing faithful visual transcription. The underlying card gives a March 2026 knowledge cutoff, with some domains potentially limited to January 2025 and others receiving newer information. Fresh-looking graphics still need a supplied or retrieved factual basis and a comparison of the rendered result with that basis.
The practical unit of control is a fact sheet: values, units, dates, labels and citations approved before generation, then checked in the image. Traceable facts and source briefs are relevant to that separation of evidence from visual presentation. They do not make the generated image self-verifying. Medical, financial, legal, scientific and current-events graphics cannot use the AutoRater score as their release authorization.
Image output is cheaper; the accepted asset may not be
The Standard paid API pricing lists image output at $30 per million tokens for 2.1 versus $60 for Nano Banana 2. Different 4K token allocations change what that apparent halving means.
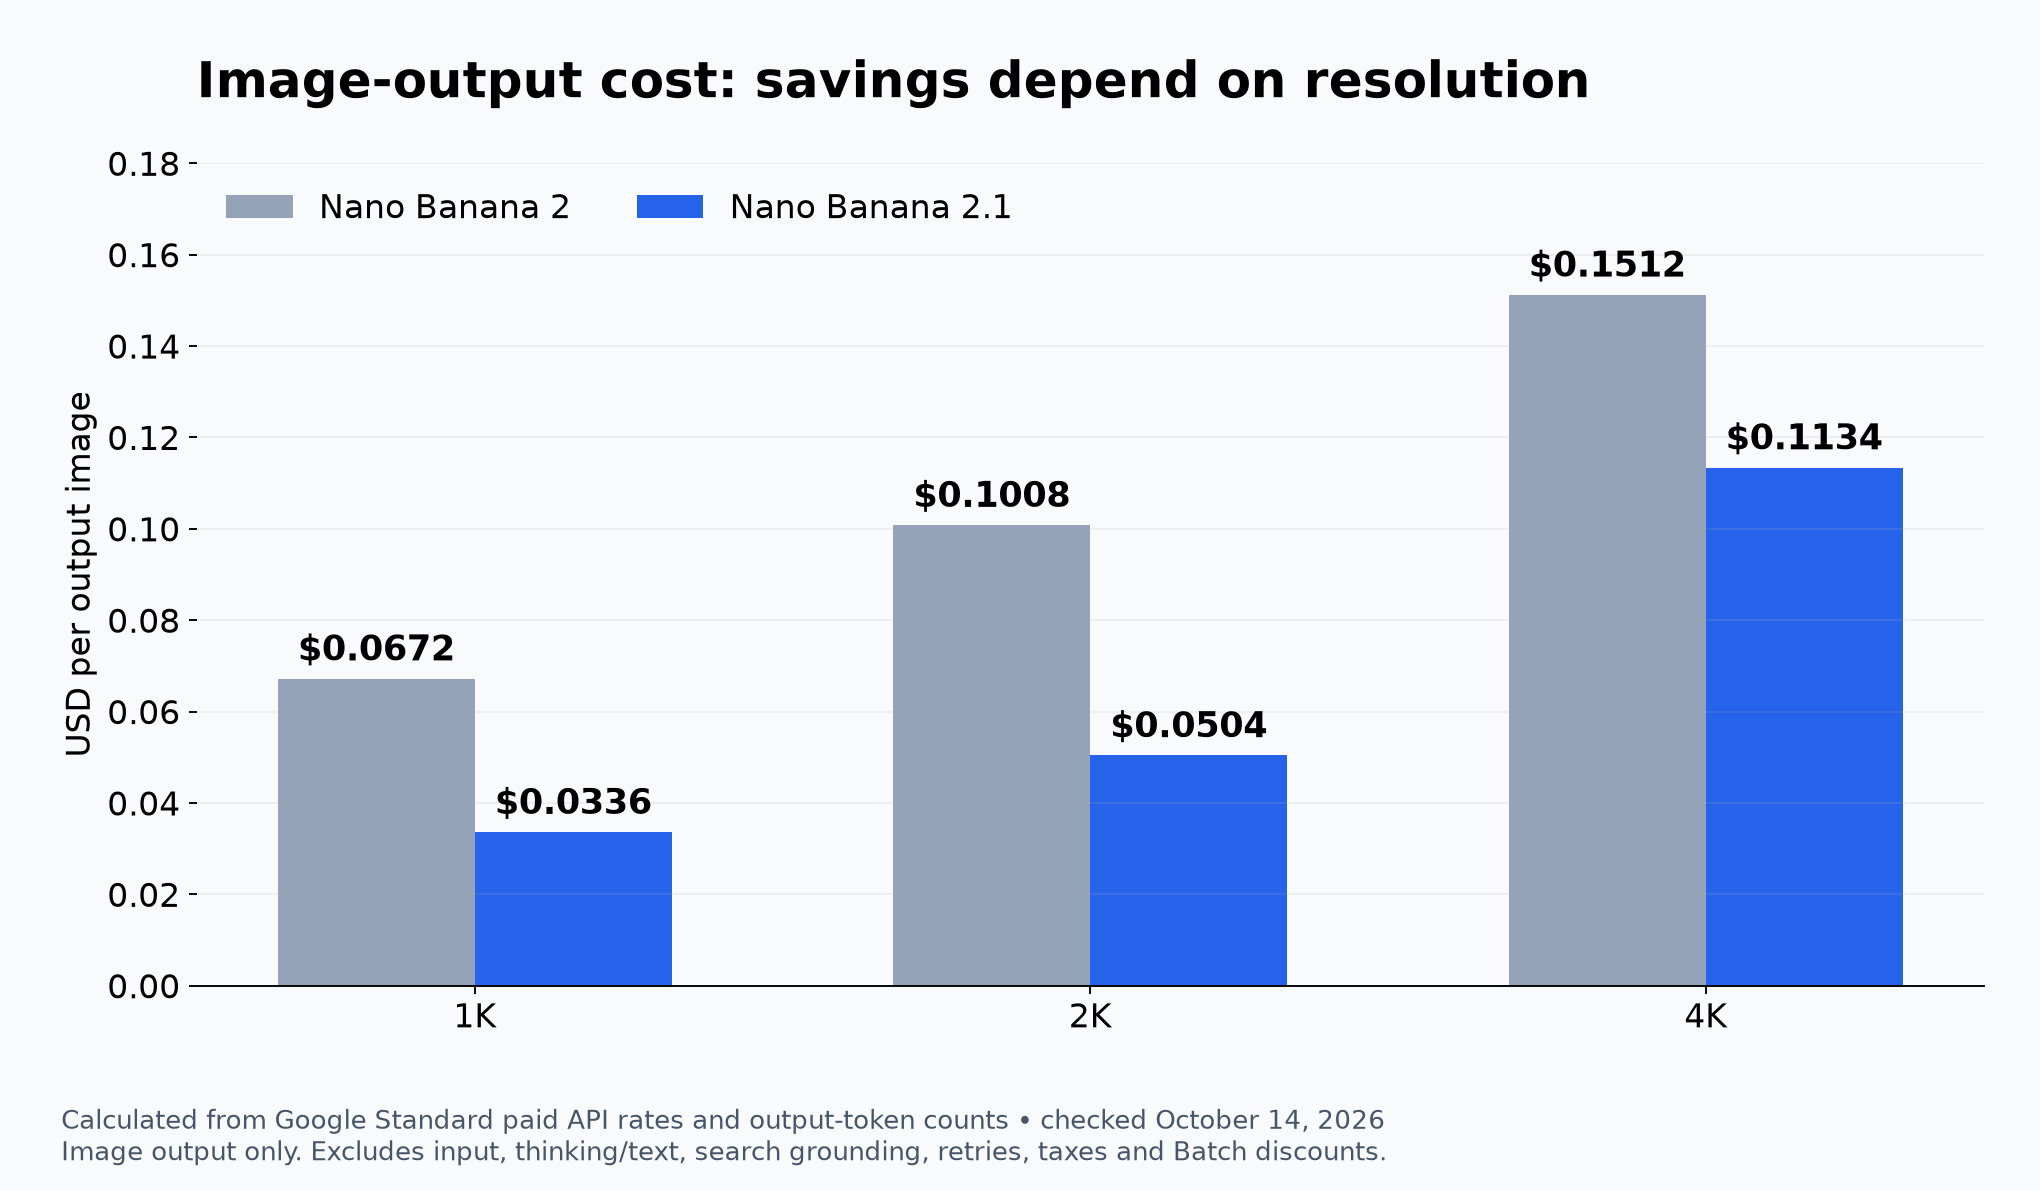
Editorial calculation using Google's published rates and allocations as of October 14. These are output-only costs, not measured total requests; the chart is not an original Google image.
At 1K, both allocations use 1,120 image tokens: $0.0336 for 2.1 versus $0.0672 for Nano Banana 2. At 2K, 1,680 tokens cost $0.0504 versus $0.1008. Those are 50% output-only reductions.
At 4K, 2.1 lists 3,780 tokens while Nano Banana 2 lists 2,520. Multiplying by their respective rates gives $0.1134 versus $0.1512—a 25% reduction, not 50%. Halving the price per token does not halve the image price when token counts increase.
Other charges move upward: Standard input is $1.50 per million text, image or video tokens for 2.1 versus $0.50 per million text or image tokens for Nano Banana 2. Text and Thinking output costs $7.50 per million tokens versus $3. Grounding, references, textual output, reasoning, retries, taxes and possible Batch discounts all affect the full bill.
There is no defensible “typical request” total without assumptions about those quantities. Better first-pass acceptance could offset reasoning charges; additional retries could erase output savings. The decision metric is cost per accepted asset, alongside observed latency and timeout rates—not an isolated output-token price.
A migration decision needs paired evidence
A useful test would pair the same real prompts and reference files across the current model and 2.1's available Thinking levels, holding aspect ratio, resolution and retry budget constant. This is a proposed evaluation, not testing performed by AI Tools Radar. Pro belongs in that comparison only if it is actually deployable; its unspecified benchmark settings cannot be assumed equivalent.
Separate single- and multi-character scenes, product edits, masks, reference composites, text-heavy layouts and factual graphics. Exact text can be transcribed and compared; masked edits need checks inside and outside the permitted region; product jobs need protected-feature checks. Blinded preference judgments can complement these tests, but cannot replace exactness where a logo or number must remain unchanged.
Keep paired results and uncertainty rather than collapsing unlike risks into one mean. Operational records should capture end-to-end latency, timeouts, retries, token consumption and cost per accepted image. A shadow phase can then show whether a benchmark advantage becomes fewer revisions in the actual workflow.
There is no source-backed October 29 retirement deadline requiring a rushed switch. The deprecations reference lists Gemini 3.1 Flash Image as deprecated without an announced shutdown date. That evidence is not a promise of indefinite availability either.
The strongest initial cases for 2.1 are infographic layout, multiple recurring characters, reference composition and cheaper image output. Thinking deserves particular attention for multi-character and factuality workloads; overlapping results leave room for simpler configurations elsewhere. Where small text, factual claims, exact identity or unchanged product regions are mandatory, keep external validation and a fallback until the new endpoint meets those requirements. The published lead is a reason to run that comparison, not a substitute for it.